


On-chain data analysis has become one of the most effective ways to understand blockchain activity beyond price movements. Public blockchains permanently record every transaction, allowing anyone to examine wallet activity, token transfers, network participation, and capital flows.
- How does on-chain data analysis improve market understanding?
- Why do wallet holdings and transactions matter?
- Which blockchain indicators reveal market trends?
- What can exchange flows and whale activity reveal?
- How do institutions and long-term investors shape blockchain signals?
- Why should blockchain data be combined with other research methods?
- Does on-chain data analysis replace traditional market research?
- Conclusion
- Glossary
- Frequently Asked Questions About On-Chain Data Analysis
Unlike traditional financial systems where transaction records remain private, blockchain networks provide transparent data that can be independently verified. This gives traders, researchers, institutions, and long-term investors access to measurable insights that support informed decision-making.
How does on-chain data analysis improve market understanding?
On-chain data analysis examines publicly available blockchain records to identify transaction patterns, wallet balances, token movements, and network activity that reflect how participants interact with digital assets. Every blockchain transaction creates a permanent record containing wallet addresses, timestamps, transferred amounts, and smart contract interactions.
By organizing and interpreting this information, analysts gain a clearer picture of whether a network is attracting new users, experiencing capital inflows, or showing signs of declining activity. Unlike technical analysis, which primarily evaluates historical price movements, blockchain data reflects actual user behavior.
This allows investors to assess network health, monitor liquidity, verify transactions, and evaluate the overall strength of decentralized ecosystems using transparent information rather than assumptions. The growing availability of blockchain analytics platforms has also made these insights accessible beyond professional trading firms. Individual investors can now monitor the same publicly available information that institutions use when evaluating blockchain activity.
Why do wallet holdings and transactions matter?
Wallet balances and transaction history form the foundation of blockchain research because every token transfer remains permanently recorded on-chain. Unlike conventional bank accounts, blockchain wallets publicly display current and historical token holdings. Analysts use this transparency to understand how assets are distributed, whether ownership is concentrated among a few large holders, and how portfolios change over time.
Transaction analysis expands this perspective by following the movement of assets between wallets. Each transfer records the sender, recipient, transferred amount, transaction hash, and timestamp. Examining these records helps analysts identify accumulation, distribution, and broader market behavior as it develops. Wallet analysis also supports independent verification. Rather than relying solely on public statements or market speculation, analysts can review blockchain records to confirm whether a wallet continues holding assets or has significantly reduced its position.
Which blockchain indicators reveal market trends?
Several blockchain indicators help analysts evaluate adoption, participation, and network strength without relying exclusively on price performance. Total Value Locked (TVL) measures the value of assets secured within smart contract protocols. Rising TVL generally reflects stronger participation in decentralized finance, while prolonged declines may indicate weakening user engagement.
Active addresses provide another widely monitored indicator. Measuring how many wallet addresses interact with a blockchain over a selected period helps analysts evaluate whether adoption is expanding or slowing. Since blockchain activity naturally changes across market cycles, comparing multiple networks over similar timeframes often provides more meaningful context.
Token holder counts also help assess market maturity. An increasing number of holders may indicate broader adoption, while ownership concentrated among a limited number of wallets can highlight potential concentration risks. Professional analysts also monitor long-term and short-term holder cohorts to distinguish between investors accumulating assets over extended periods and those actively trading.
In on-chain data analysis, shifts between these groups have historically aligned with broader market cycle transitions, offering additional context beyond price movements alone. Likewise, realized valuation metrics such as MVRV help estimate whether most market participants are holding assets at a profit or loss, providing another perspective on whether market conditions appear overheated or deeply discounted.
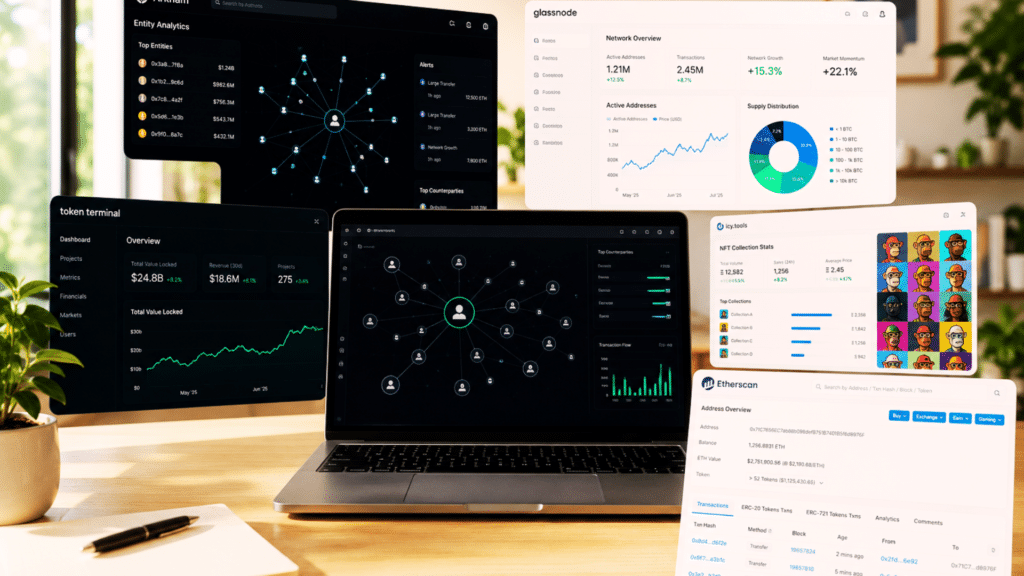
Some analysts also monitor stablecoin supply, transfer activity, and network fees alongside traditional blockchain metrics, since rising stablecoin usage and sustained fee activity can indicate improving liquidity and stronger demand across blockchain ecosystems. Blockchain explorers including EtherScan, BscScan, and SolScan provide direct access to these metrics, while platforms such as CoinMarketCap DexScan simplify monitoring of on-chain trading activity across multiple ecosystems.
What can exchange flows and whale activity reveal?
Exchange flows and whale transactions frequently provide valuable insight into changing market sentiment because they reflect how large participants position their assets. Assets moving from private wallets to exchange addresses are commonly interpreted as a potential sign that holders intend to trade or sell.
By contrast, assets leaving exchanges for personal wallets often suggest longer-term storage because they are being removed from active trading venues. Monitoring these trends over longer periods helps analysts identify whether capital is entering or leaving the broader crypto ecosystem. Consistent patterns generally provide stronger signals than isolated transactions.
Whale activity remains another closely followed indicator in on-chain data analysis. Large holders can influence market sentiment through significant transfers, making their wallet activity an important area of observation. One notable example involved a Bitcoin wallet that remained inactive for more than ten years before transferring 400 Bitcoin on April 24, 2023.
The wallet had originally accumulated 1,000 Bitcoin during May 2011 when Bitcoin traded at approximately $5–10. By the time part of those holdings moved, the transferred assets were valued at more than $10 million. Cases like this demonstrate how blockchain transparency allows analysts to monitor significant capital movements before broader market reactions unfold.
How do institutions and long-term investors shape blockchain signals?
Institutional participation has added another layer of transparency to blockchain markets. The approval of spot Bitcoin exchange-traded funds in the United States enabled analysts to monitor publicly identified ETF wallets and observe inflows and outflows as they occur. Tracking these movements provides another indicator of institutional participation alongside broader blockchain activity.
Corporate treasury adoption has created similar opportunities. Companies that publicly disclose blockchain wallet addresses allow investors to independently verify digital asset holdings rather than relying exclusively on periodic financial reports. Long-term holder analysis further strengthens market research.
Comparing wallets based on how long assets remain unmoved helps analysts distinguish between strategic accumulation and short-term speculation. Ethereum has also demonstrated how entity tracking can influence market expectations, with participants historically monitoring transfers involving the Ethereum Foundation because notable movements to centralized exchanges have occasionally preceded increased selling pressure.
Why should blockchain data be combined with other research methods?
Blockchain records provide valuable evidence, but they become significantly more useful when interpreted alongside technical and fundamental analysis. Technical analysis focuses primarily on historical price charts, trading volume, and market structure. Blockchain analysis examines actual user behavior recorded on public ledgers.
Combining these approaches allows analysts to understand not only how prices are moving but also why market participants may be behaving in a particular way. Network-level indicators such as transaction volume, daily transactions, unique token holders, and Total Value Locked help evaluate ecosystem growth over longer periods.
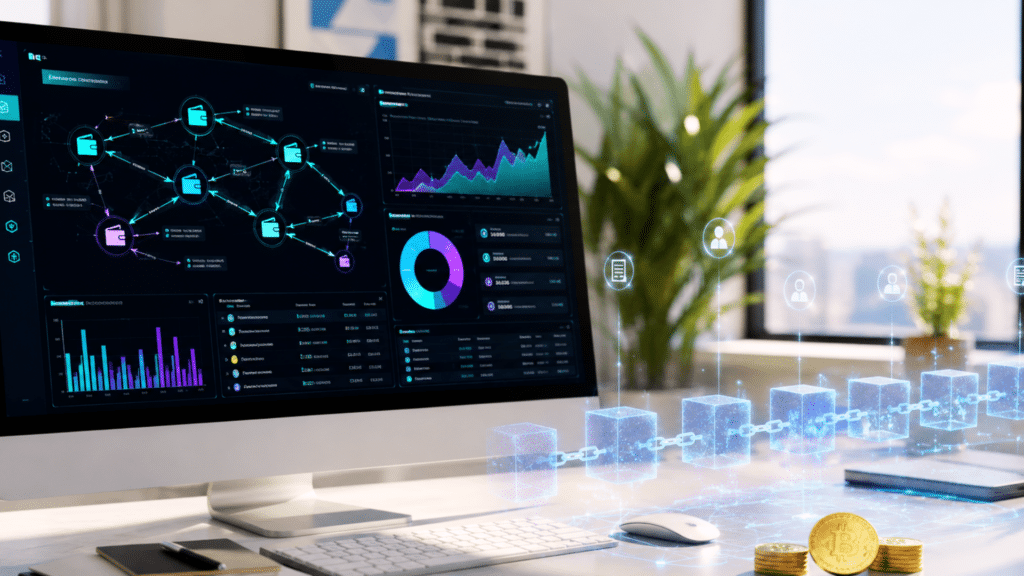
At the same time, wallet activity, exchange flows, and transaction records provide valuable insight into shorter-term positioning. Visualization platforms further strengthen on-chain data analysis by displaying wallet relationships, fund movements, and ownership structures through interactive dashboards, making complex blockchain activity easier to interpret.
Does on-chain data analysis replace traditional market research?
No. On-chain data analysis should complement rather than replace established market research methods. Public blockchain records provide unmatched visibility into wallet activity, transaction flows, network participation, and capital movement. However, price action, macroeconomic developments, liquidity conditions, derivatives positioning, and broader investor sentiment continue to influence digital asset markets.
Blockchain data also has limitations. Internal wallet transfers, exchange operational movements, and activity occurring outside public blockchains, including certain over-the-counter transactions, may not always reflect genuine market demand. For this reason, experienced analysts typically compare multiple blockchain indicators alongside technical and fundamental research before drawing conclusions.
Conclusion
On-chain data analysis continues to play an increasingly important role in evaluating blockchain markets by transforming publicly available transaction records into actionable market intelligence. Metrics such as wallet holdings, active addresses, Total Value Locked, exchange flows, token holder distribution, and whale activity help analysts understand participation, liquidity, and market sentiment beyond price alone.
When combined with technical and fundamental analysis, these blockchain indicators provide a more balanced framework for interpreting market cycles and identifying long-term trends across digital asset ecosystems.
Glossary
Wallet Address: A unique crypto account for sending and receiving assets.
Active Addresses: Wallets that participate in blockchain transactions.
Total Value Locked (TVL): The total value of assets locked in DeFi.
Token Holder: A wallet that owns a cryptocurrency or token.
Capital Outflows: Funds moving out of a blockchain ecosystem.
Frequently Asked Questions About On-Chain Data Analysis
Can beginners use on-chain data analysis?
Yes. Many blockchain tools make on-chain data analysis easy for beginners to understand.
Which metrics are useful for beginners?
Active addresses, TVL, exchange flows, and whale activity are good starting metrics.
Should on-chain data analysis be used alone?
No. It works best when combined with technical analysis and market research.
Why is on-chain data important?
It helps investors understand how cryptocurrencies move and how blockchain networks are being used.
What information does a blockchain transaction contain?
A blockchain transaction records wallet addresses, transferred amounts, timestamps, and transaction details.