



Bitcoin has rebuilt part of its market structure after climbing from a July low of $57,800 to roughly $65,777 in 22 days. The recovery has reduced losses for recent buyers, while accumulation and a bullish crossover suggest momentum is improving. The next Bitcoin price prediction still depends on fresh spot demand.
Bitcoin Price Prediction Improves as Holder Losses Shrink
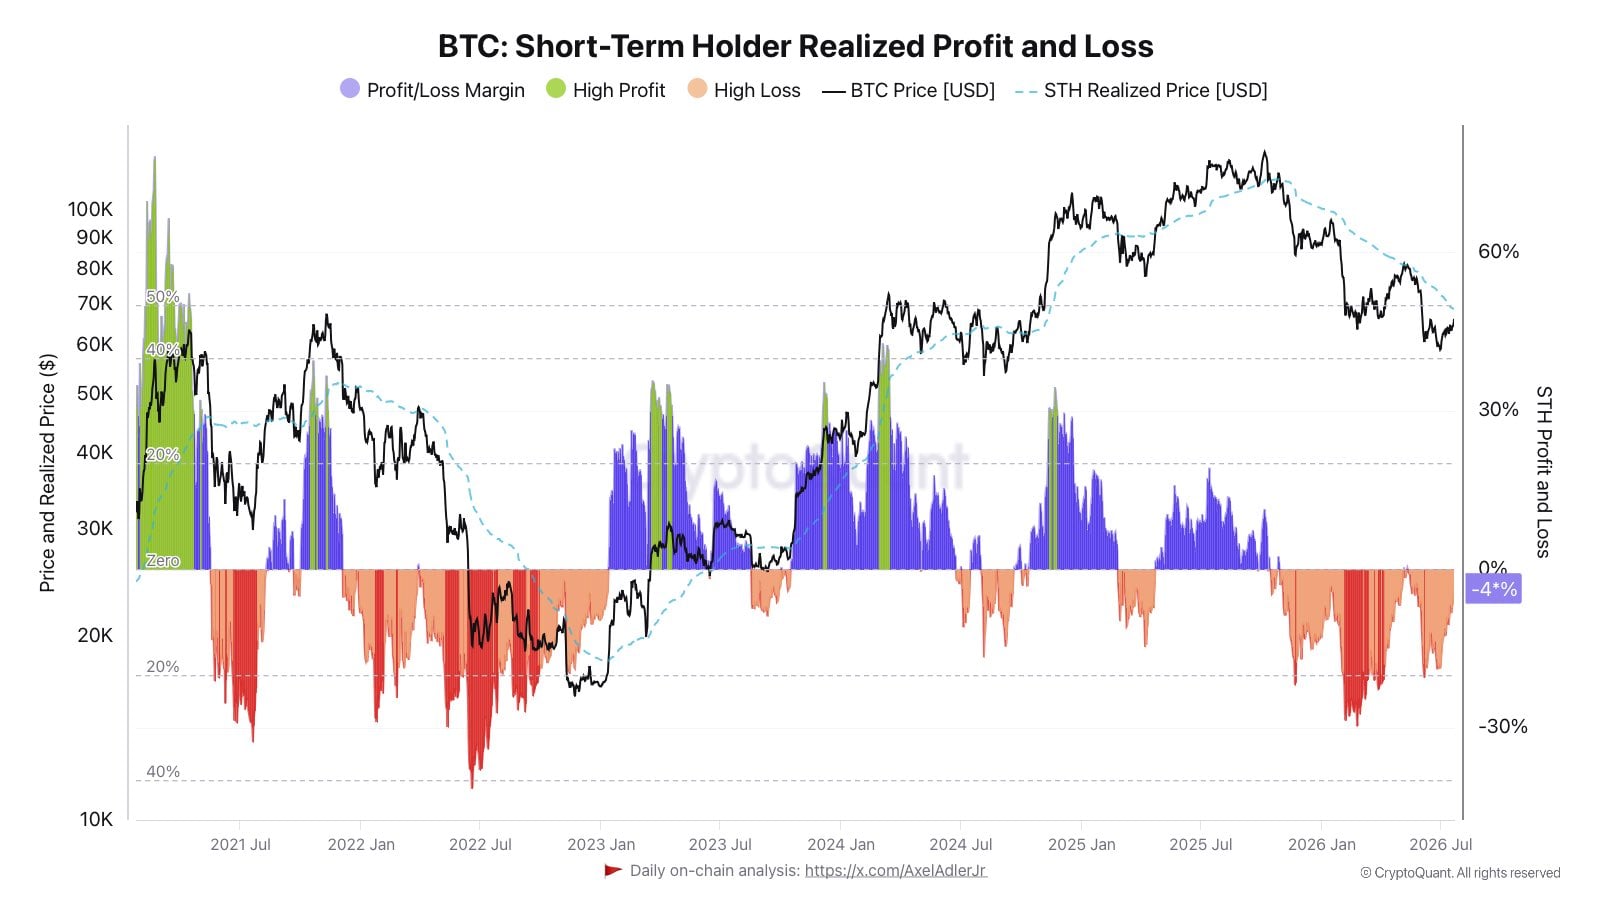
Short-term holders, defined as investors who have owned Bitcoin for fewer than 155 days, have an estimated cost basis near $68,800. With Bitcoin below that level, the group remains underwater, but its realized loss margin has narrowed to about 4%, compared with 20.48% on June 6.
That shift matters because investors sitting close to break-even often become less willing to sell. Rather than lock in a modest loss, many may wait for price to revisit their entry level. This behavior can reduce immediate market supply, giving buyers more room to push upward. For any Bitcoin price prediction, the $68,800 area now serves as both a technical hurdle and a psychological checkpoint.
Accumulation Data Shows Buyers Are Returning
The Accumulation/Distribution indicator has risen to about 4.69 million, signaling that buying volume has outweighed selling volume over time. A rising reading does not guarantee a rally, but it suggests investors are collecting coins rather than rushing for the exit.
This supports the bullish side of the current Bitcoin price prediction. Price may look calm, yet supply can still be absorbed beneath the surface.
Golden Cross Adds Momentum to Bitcoin’s Recovery
A golden cross formed around July 19 and July 20 when Bitcoin’s 20-day simple moving average moved above its 50-day average. Traders often view this crossover as evidence that short-term momentum is becoming stronger than the broader trend.
The previous comparable setup in April was followed by an advance of nearly 17%, from about $70,500 to above $82,458. The crossover gives the Bitcoin price prediction another constructive signal.
Bitcoin Price Levels and Market Signals
| Indicator | Current Reading | Market Meaning |
|---|---|---|
| Recent July low | $57,800 | Key rebound base |
| Recent price | $65,777 | Recovery remains active |
| Short-term holder cost basis | $68,800 | Main break-even resistance |
| Holder loss margin | 4% | Selling pressure may ease |
| Accumulation/Distribution | 4.69 million | Gradual buying is visible |
| Spot and perpetual netflows | -170,000 BTC | Demand remains weak |
The table explains why the Bitcoin price prediction is cautiously positive rather than fully bullish. Structure is improving, but stronger demand must confirm the move.
Weak Netflows Remain the Main Risk
Combined spot and perpetual netflows reportedly fell to negative 170,000 BTC by July 21. Negative netflows can reflect weak buying pressure or stronger outflows, depending on market behavior. Buyers have not shown enough force to turn the recovery into a clean breakout.
Bitcoin may struggle near $68,800 unless spot participation improves. A breakout backed by real buying volume would make the Bitcoin price prediction more credible. A rejection could return price toward the lower part of its recent range.
Conclusion
Bitcoin’s rebound has gained a firmer base as short-term holder losses narrow, accumulation rises, and the golden cross remains intact. The market is no longer carrying the same strain seen in June. Even so, stronger spot demand is needed before the Bitcoin price prediction can shift from cautious recovery to sustained uptrend.
Frequently Asked Questions
Why is $68,800 important?
It is the estimated average cost basis for short-term holders and may act as resistance.
What does a golden cross mean?
It forms when a shorter moving average rises above a longer one, suggesting improving momentum.
Can Bitcoin rebound without positive netflows?
It can rise temporarily, but lasting gains usually need consistent buyer demand.
Glossary of Key Terms
Cost basis: The average price investors paid for an asset.
Short-term holder: An investor holding Bitcoin for fewer than 155 days.
Golden cross: A bullish crossover between short-term and longer-term moving averages.
Netflow: The balance of assets moving into and out of trading markets.
Bitcoin price prediction: An evidence-based estimate of possible future price direction.
Disclaimer: This article is for informational purposes only and does not provide financial advice.