




Bitcoin price prediction remains in focus as the latest market data highlights a contrast between improving short-term market conditions and a broader price structure that continues to favor caution. Bitcoin is currently trading around $62,702.02, down 3.23% over the past 24 hours, showing that volatility persists despite signs of renewed buying activity.
- What does Bitcoin price prediction reveal about the current market setup?
- Why is Bitcoin still struggling below resistance?
- Why are analysts remaining cautious?
- What does derivatives activity suggest?
- Which price levels could determine the next move?
- What do the latest technical indicators show?
- Conclusion
- Glossary
- Frequently Asked Questions About Bitcoin Price Prediction
The recent rebound has strengthened several market indicators, but it has not yet confirmed a shift in the larger trend. Unless Bitcoin clears key resistance, the market remains vulnerable to another leg lower while leaving room for a stronger recovery if buyers regain control.
What does Bitcoin price prediction reveal about the current market setup?
Bitcoin price prediction points to improving short-term sentiment, although the broader trend has yet to confirm a reversal. The latest assessment is based on the Bitcoin Regime Score, a metric that combines taker flow, funding rates, open interest, exchange flows, ETF flows, and price trends.

Crypto analyst Axel Adler Jr. stated that the latest reading of +34.6 placed the indicator in modestly bullish territory. The regime score briefly slipped below zero on July 14 before recovering as buying pressure returned. That rebound pushed the indicator back into bullish territory for a second consecutive week, suggesting that several near-term market components have improved.
However, the analyst also noted that the stronger regime score remains at odds with broader price trend expectations. While short-term market conditions have strengthened, the higher-timeframe structure continues to lean bearish.
Why is Bitcoin still struggling below resistance?
The latest recovery has yet to overcome one of the market’s most important technical barriers. Bitcoin declined to $62.2K on July 13 before gaining 4.45% the following day and briefly moving above $65K. Over the next 48 hours, the asset slipped another 1.37% as selling pressure returned.
Technical analysis identified $65,260 as the 78.6% Fibonacci retracement level using the four-hour swing structure. The rejection from that level reinforced it as a major resistance zone, indicating that the broader bearish structure remains intact despite improving short-term momentum.
Why are analysts remaining cautious?
The recent rebound has not been supported by stronger underlying demand. Earlier market commentary highlighted fragile market conditions that could delay a sustained recovery. A Bitfinex analyst stated that there was no Bitcoin-specific demand in the market, while ETF flows remained negative.
The Coinbase Premium Index also continued to reflect weak buying interest. This backdrop explains why the latest recovery has not yet developed into a confirmed trend reversal. Improving short-term signals alone are not enough without stronger demand supporting the move.
What does derivatives activity suggest?
Recent derivatives data indicates that market leverage is cooling rather than unwinding through panic selling. The rejection near $65K resulted in around $52 million in BTC trader liquidations over the past 24 hours. While the move rejected higher prices, it did not trigger the type of liquidation cascade seen during previous declines.
For comparison, nearly $980 million in liquidations occurred on June 23 when Bitcoin fell from $64.2K to $62K during the broader decline from $74K to $60K. The relatively smaller liquidation figures suggest traders are adjusting positions instead of rushing to exit.
Current market data supports that view. Bitcoin futures trading volume reached $52,874,330,256, while approximately $93,501,278 worth of futures positions were liquidated. Open interest currently stands at $46,795,910,892, indicating leverage continues to adjust.
Coinglass data also showed total Bitcoin liquidations of $94.93 million over the past 24 hours, including $80.39 million in long positions and $14.54 million in short positions. Meanwhile, derivatives volume increased 14.23% to $53.48 billion, open interest declined 4.03% to $46.90 billion, options volume dropped 34.37% to $2.77 billion, and options open interest edged 0.98% higher to $30.29 billion.
| Metric | Value |
|---|---|
| Bitcoin current price | $62,702.02 |
| 24h price change | -3.23% |
| Market cap | $1.25T |
| Bitcoin dominance | 58.2% |
| Bitcoin Regime Score | +34.6 |
| Regime Score status | Bullish territory |
| Key resistance | $65,260 |
| Upside target | $77,489 |
| 24h BTC futures liquidations | $94.93M |
| ETF flow backdrop | Negative |
Which price levels could determine the next move?
The next move depends on whether Bitcoin breaks resistance or continues following the existing bearish structure. The higher-timeframe trend remains bearish based on the impulse move from $82,850 to $51,888, with Fibonacci retracement levels identifying key technical areas.
If sellers continue defending resistance, Bitcoin could extend its decline toward $55,560, with $51,934 acting as another downside target over the coming weeks. The bearish outlook would only be invalidated if Bitcoin records a four-hour session close above $67,292. Under that scenario, analysts believe the market could rally toward $77,489 before the higher-timeframe downtrend potentially resumes.
What do the latest technical indicators show?
Current market indicators continue to present a mixed picture despite improving short-term conditions. Bitcoin traded between an intraday low of $62,666.84 and a high of $64,832.47 over the past 24 hours. Its market capitalization stood at $1.25 trillion, down 3.17% over the past 24 hours. Trading volume increased 8.52% to $29.35 billion, while the volume-to-market-cap ratio was 2.3%. Bitcoin dominance remained at 58.2%.
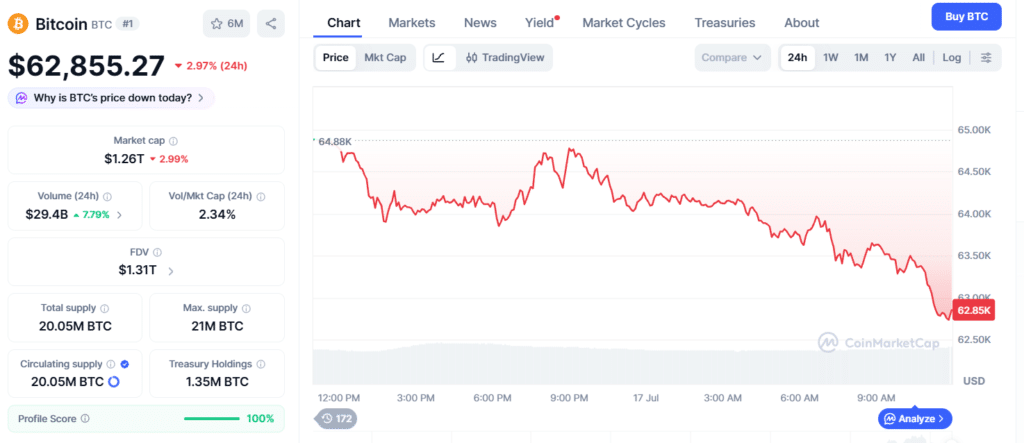
TradingView data shows the Relative Strength Index (14) at 47, indicating neutral momentum, while the Average Directional Index (14) also remains neutral at 23. Momentum (10) continues to generate a sell signal, whereas the MACD Level (12,26) maintains a buy signal.
Longer-term indicators remain cautious. The 50-day Simple Moving Average stands at 63,686 with a sell signal, while the 100-day Simple Moving Average remains at 70,431 and also signals selling pressure.
Conclusion
Bitcoin price prediction continues to reflect a market balancing stronger short-term signals against a broader bearish structure. The Bitcoin Regime Score suggests that several near-term market components have improved, but weak Bitcoin-specific demand, negative ETF flows, and a subdued Coinbase Premium Index continue to limit confidence in a sustained recovery.
Until Bitcoin secures a four-hour close above $67,292, downside targets at $55,560 and $51,934 remain technically valid. A confirmed breakout above that level would instead strengthen the case for a move toward $77,489. For now the market setup continues to favor caution while both scenarios remain open.
Glossary
Bitcoin Regime Score- A metric that tracks overall Bitcoin market sentiment.
Fibonacci Retracement- A tool used to identify potential support and resistance.
Open Interest- The total number of active derivatives contracts.
ETF Flows- Money moving into or out of Bitcoin ETFs.
Coinbase Premium Index- A measure of Bitcoin demand on Coinbase.
Frequently Asked Questions About Bitcoin Price Prediction
Why did Bitcoin fail to stay above $65K?
Bitcoin faced strong selling pressure near $65K. Which makes it difficult for buyers to push the price higher.
Why are analysts still cautious about Bitcoin?
Analysts remain cautious because ETF flows are weak and overall demand for Bitcoin is still limited.
What are the next support levels for Bitcoin?
The next major support levels are around $55,560 and $51,934 if selling pressure continues.
What price could confirm a bullish breakout?
A four-hour close above $67,292 could strengthen the case for a larger upward move.
How do Bitcoin ETF flows affect the market?
Bitcoin ETF flows help show whether institutional investors are buying or selling Bitcoin.