



Bitcoin’s rebound above $66,000 has revived a question traders have debated since the latest correction: did the market already print a lasting cycle low? Three long-term readings now resemble earlier Bitcoin bottoms, yet the Bitcoin price still needs liquidity to reach $70,000.
- Bitcoin Price Gains Support From Three Macro Signals
- Historical Patterns Strengthen the Bottom Case
- Liquidity Could Decide Whether $70,000 Breaks
- What Traders Should Watch Next
- Conclusion
- Frequently Asked Questions
- Can Bitcoin reach $70,000 soon?
- What does a monthly RSI near 43 mean?
- Why do stablecoin outflows matter?
- Glossary of Key Terms
Bitcoin Price Gains Support From Three Macro Signals
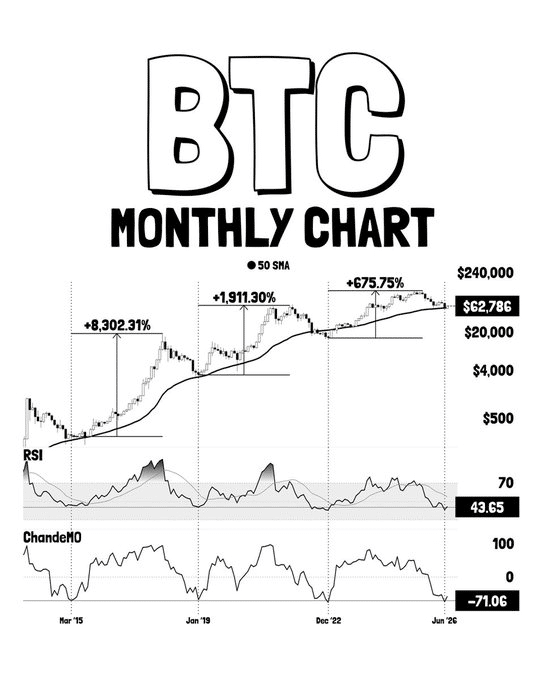
The first signal comes from the monthly Relative Strength Index, or RSI, which recently fell near 43.65. RSI measures the speed and strength of price changes on a scale from 0 to 100. Readings below 30 often suggest an asset is oversold, while levels above 70 can point to overheated demand. A reading in the low 40s is not an automatic buy signal, but it shows long-term momentum has cooled.
The second indicator is the Chande Momentum Oscillator, which dropped close to -71. The CMO compares recent gains with recent losses and moves between -100 and 100. Deeply negative readings show that selling pressure has dominated. When that pressure begins to ease, the Bitcoin price can enter a recovery phase, especially when other long-term measures confirm the shift.
The third signal is Bitcoin trading near its 50-month moving average. It smooths almost 4 years of monthly prices, helping investors separate the broad trend from daily noise. In previous cycles, contact with this average occurred near periods when fear was high and long-term valuations had compressed.
Historical Patterns Strengthen the Bottom Case
A similar combination appeared around $235 in 2015, near $3,333 in early 2019, and close to $16,000 in late 2022. Each period was followed by a large multiyear advance. Those comparisons explain why some analysts believe the recent fall toward $58,000 may have marked more than a temporary low.
Still, history is a guide, not a contract as market structure has changed through funds, custody, derivatives, and broader participation. The Bitcoin price may follow the rhythm of earlier cycles without repeating their exact gains or timing.
Liquidity Could Decide Whether $70,000 Breaks
The technical setup looks constructive, but liquidity remains the missing piece. Stablecoins often act as ready cash inside crypto markets. When their supply grows on exchanges, traders usually have more capital available to buy Bitcoin and other assets. When those balances fall, rallies can lose fuel.
The total stablecoin market value reportedly declined by more than $10 billion over the past month, while stablecoins left exchanges for 35 straight days. At the same time, spot accumulation remained limited. That mismatch matters because the Bitcoin price has advanced faster than immediately available buying power.
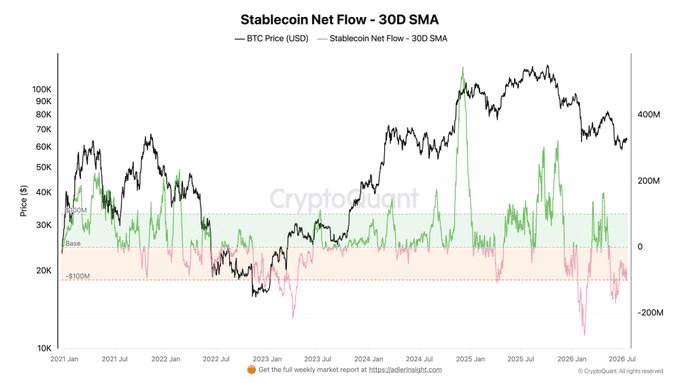
Stablecoin dominance near 13% also suggests investors are still holding a large share of crypto value in dollar-linked assets. This can be positive if that capital returns to risk assets, but it can also reflect caution. Until exchange balances and spot demand improve, the Bitcoin price may face repeated selling near $70,000.
What Traders Should Watch Next
The clearest confirmation would be sustained spot buying rather than a derivatives-led squeeze. Rising stablecoin deposits, stronger buyer inflows, and higher spot volume would show that capital is supporting the breakout. A clean hold above $66,000 would also help the Bitcoin price build a stronger base.
On the downside for Bitcoin price, a return below $65,000 could expose the $60,000 to $62,000 area again. Losing that zone would weaken the bottom thesis and raise the risk of another test near $58,000. For now, the Bitcoin price sits between improving long-term momentum and cautious short-term liquidity.
Conclusion
The three macro indicators offer a credible case that Bitcoin price may have formed a major bottom. RSI, CMO, and the 50-month moving average have aligned near important turning points before. However, the Bitcoin price still needs deeper spot demand and stronger stablecoin liquidity to turn a technical rebound into a durable push above $70,000.
Frequently Asked Questions
Can Bitcoin reach $70,000 soon?
It can, but stronger spot demand and improving exchange liquidity would make the move more sustainable.
What does a monthly RSI near 43 mean?
It shows long-term momentum has cooled, though Bitcoin is not deeply oversold by the standard RSI threshold.
Why do stablecoin outflows matter?
They can reduce capital available for crypto purchases.
Glossary of Key Terms
RSI: A momentum indicator measuring the speed and strength of price changes.
CMO: An oscillator comparing recent gains and losses to identify buying or selling pressure.
Moving average: A smoothed price line used to identify the broader market trend.
Spot accumulation: Direct buying of Bitcoin rather than exposure through futures or derivatives.
Stablecoin liquidity: Dollar-linked crypto capital available for trading and settlement.
Disclaimer: This article is for informational purposes only and does not provide financial advice.