



Solana price action has caught the attention of chart watchers this week after a technical signal that has not appeared since last year flipped back on. Traders who lived through the coin’s brutal 2025 drawdown know why this matters, because the last time this indicator turned red, SOL lost nearly three-quarters of its value in the months that followed. Now the same tool points the other way, and the real question is whether this recovery has legs or whether it is just another bounce before the next leg down.
A Signal Traders Have Not Seen in Months
The SuperTrend indicator, a tool that tracks momentum by plotting a line above or below price depending on the prevailing trend, just flipped to green on the three-day chart. That marks the first bullish reading since 2025, and given how accurately it called the previous top, traders are treating it as more than noise. It does not guarantee a straight line higher, but this kind of flip has historically marked turning points rather than dead-cat bounces.
Solana Price Momentum Builds Across Trading Desks
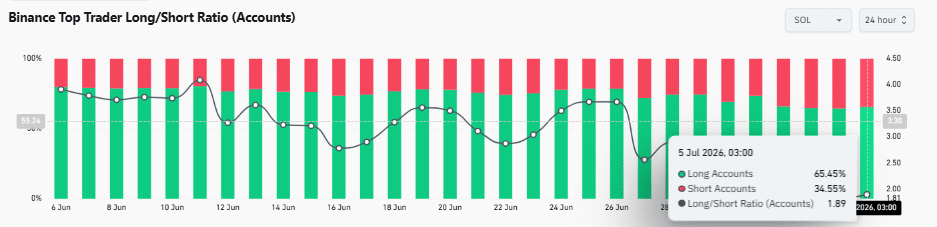
Positioning data tells an interesting part of the puzzle. On a major derivatives exchange, long positions accounted for roughly 65 percent of open contracts against 35 percent short, putting the long-short ratio near 1.89. That kind of imbalance usually shows up when bigger players keep adding exposure through choppy stretches instead of folding at the first sign of resistance, and it suggests conviction has not wavered much since Solana price bounced off its June lows.
What Funding Rates Reveal About Trader Confidence
Funding rates back up that reading. The open-interest weighted funding rate has stayed in positive territory, hovering around 0.0027 percent, which means traders holding long positions are still willing to pay a small premium to keep them open. It is not an extreme number that would scream an overheated market, but steady positive funding over time usually reflects patient demand rather than a quick speculative rush. For anyone tracking Solana price, that steadiness matters more than a single day’s spike.
Key Chart Levels Traders Are Watching Now
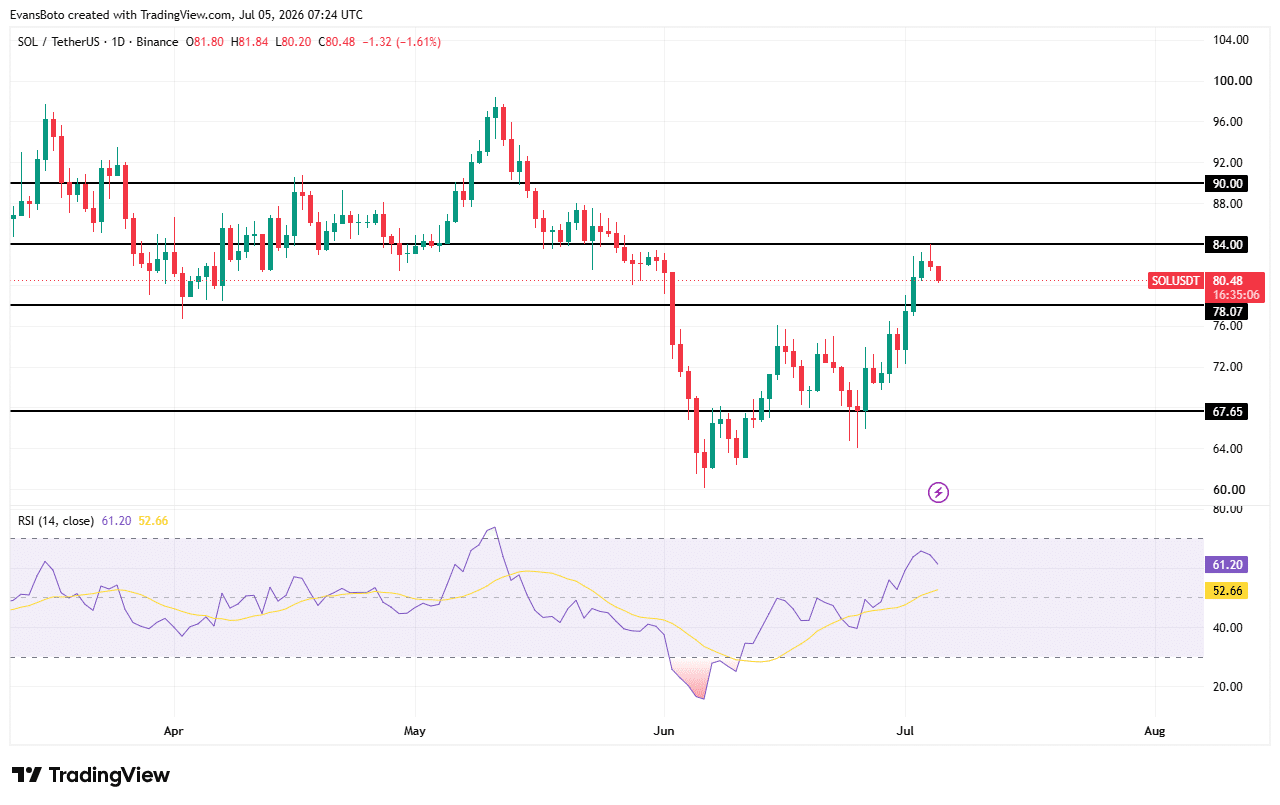
Solana price has climbed back from a June low near $60 and has repeatedly run into a ceiling around $84. Support has held firm at $78.07, and buyers have defended that zone each time sellers tested it. The relative strength index sits close to 61, comfortably above the neutral 50 mark, while the price trades above its 50-day moving average near $52.66. Both readings lean bullish, though momentum has cooled slightly the closer price gets to resistance, which is fairly typical behavior before a breakout attempt.
The Road to $90 and What Comes After
A confirmed close above $84 would likely open the door toward $90, and from there, market chatter tends to shift quickly toward the psychological $100 mark. That said, resistance zones rarely fall on the first try. A pullback toward the $78 support shelf would not be surprising even in a healthy uptrend, since retests often shake out weaker hands before the next push. Anyone watching Solana price right now should treat $84 as the line in the sand rather than assume it breaks cleanly on the first attempt.
Risks That Could Derail the Rally
No setup is bulletproof as a sudden shift in broader market sentiment, a spike in Bitcoin volatility, or a wave of long liquidations could all knock Solana price back toward support faster than the charts suggest. Leverage cuts both ways, and the same long positioning that looks bullish today can turn into a wave of forced selling if price reverses sharply.
Conclusion
Solana price sits at a genuinely interesting crossroad as the SuperTrend flip, the lopsided long positioning, and steady positive funding all point toward buyers holding the upper hand for now. Still, resistance near $84 has not broken yet, and until it does, the setup remains a promising one rather than a confirmed breakout.
Frequently Asked Questions
What is the SuperTrend indicator?
It is a trend-following tool that shifts between bullish and bearish signals based on price and volatility, helping traders spot potential reversals.
What does a long-short ratio of 1.89 mean?
It means long positions outnumber short positions by nearly two to one, showing traders are leaning bullish on Solana price.
Is $90 guaranteed for Solana?
No. It is a technical target based on chart patterns and momentum, not a certainty.
What happens if $84 resistance holds?
SOL could pull back toward the $78 support zone before attempting another breakout.
Glossary of Key Terms
Funding Rate: A periodic payment between long and short traders in perpetual futures markets, reflecting overall positioning bias.
Open Interest: The total number of outstanding derivative contracts that have not been settled.
RSI (Relative Strength Index): A momentum indicator ranging from 0 to 100 that shows whether an asset is overbought or oversold.
Support and Resistance: Price levels where buying or selling pressure has historically been strong enough to pause or reverse a trend.
Disclaimer: This article is for informational purposes only and does not constitute financial advice.
Sources