



The Hyperliquid price just cracked a level that swing traders had been leaning on for weeks, and the timing could not be more interesting. Open interest on the chain touched a record 11.07 billion dollars on July 13, yet the token itself is sliding under its mid-range support at 64 dollars. That kind of split, where activity on the platform keeps climbing while the token cools off, tends to catch traders off guard, and it is worth digging into what is actually going on beneath the surface.
Record Open Interest Meets A Cooling Token
Hyperliquid’s total open interest reached its highest point of the year this week, according to data shared by Wu Blockchain. HIP-3 markets, the newer improvement proposal tied to the platform’s expanding product suite, contributed 3.69 billion dollars of that figure, itself a fresh record. That is not a small number. It signals that traders are still actively using the exchange for leveraged positions even as the spot price wobbles.
There is a wrinkle worth mentioning, though. Just days before this report, Robinhood Chain, a newer Ethereum layer-2 network, briefly overtook both Hyperliquid and BNB in daily speculative interest, largely on the back of viral memecoin launches like CashCat. Whether that pace holds once the memecoin hype fades is anyone’s guess, and frankly, these speculative waves tend to come and go like tides. For now, Hyperliquid remains the more established, market-tested product, and that matters when investors weigh where to park real capital versus where to chase a quick flip.
The Bigger Picture Still Favors The Bulls
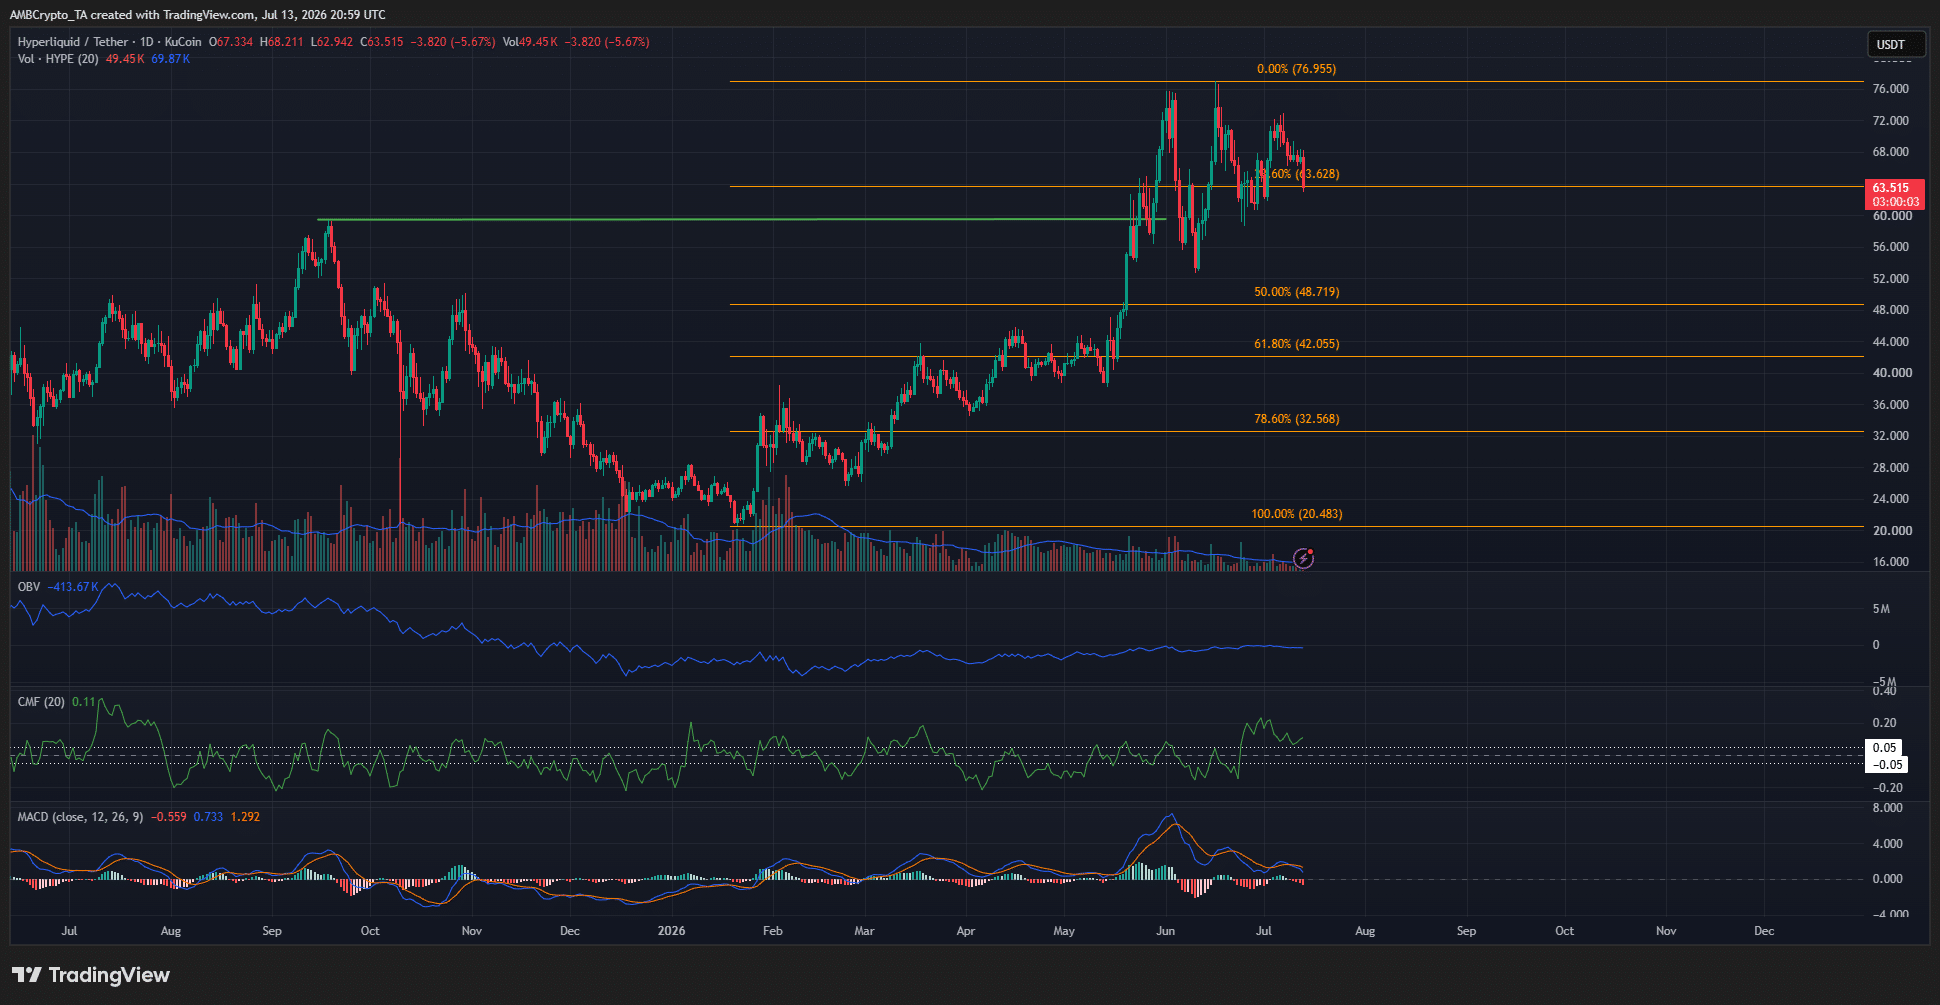
Zoom out, and the Hyperliquid price chart tells a fairly constructive tale as back in May, the token broke above its previous swing high of 59.412 dollars, confirming an uptrend that carried it to a new peak of 76.955 dollars. That is the kind of structural breakout technical analysts get excited about, since it usually marks a shift in control from sellers to buyers.
Mapping Fibonacci retracement levels across the move from 20.48 dollars to 76.95 dollars places the golden pocket, the zone where trend resumptions often begin, between 32.56 dollars and 42.05 dollars. That sits well beneath current levels, so nobody should assume a crash is imminent over a short-term wobble. The Chaikin Money Flow indicator sits above 0.05, and on-balance volume keeps climbing, both hints that buyers have not fully abandoned ship. The MACD, meanwhile, is flattening out, a subtle sign that bullish momentum is losing some of its punch.
Hyperliquid Price Signals Turn Bearish Short-Term
Here is where things get tricky for anyone trading the smaller timeframes. Since early June, the Hyperliquid price has been boxed inside a range between 53.3 dollars and 74.6 dollars, essentially chopping sideways while the broader trend stays intact. This week, that range broke down in a meaningful way when the token slipped below its mid-range support of 64 dollars.
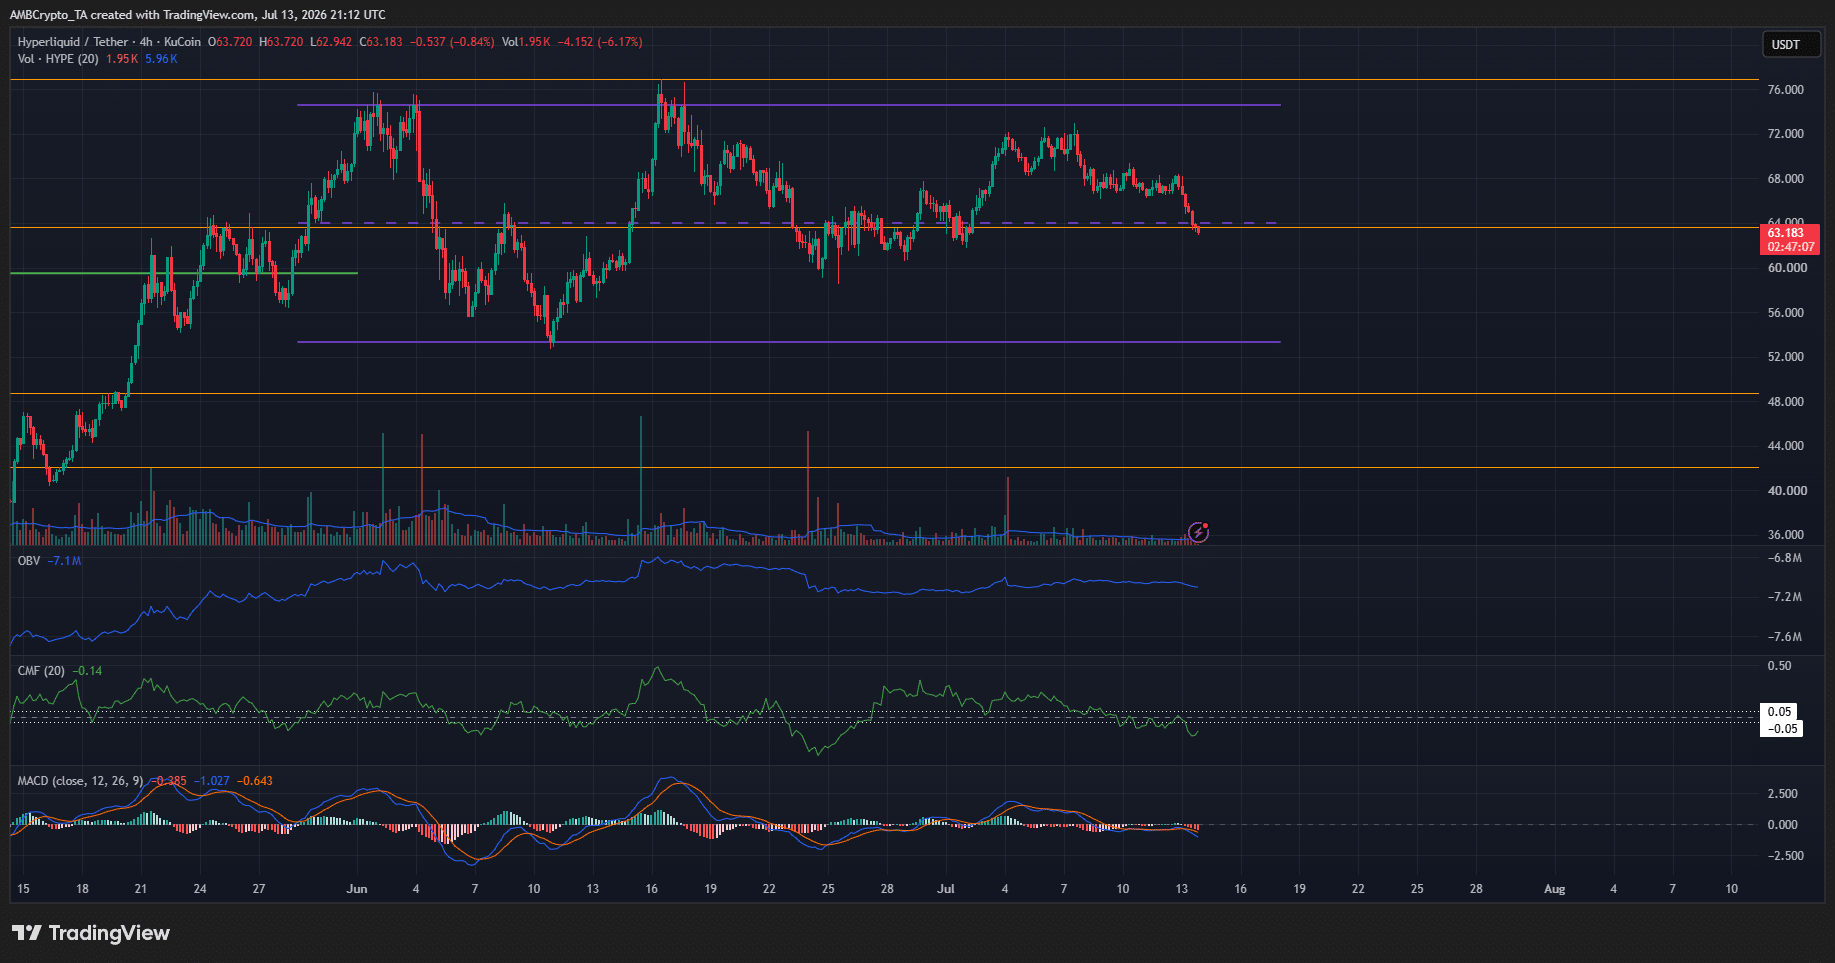
That break matters more than it might seem at first glance. The Chaikin Money Flow reading dropped to negative 0.14, pointing toward real capital leaving the token rather than simple noise. Add in a bearish MACD crossover below the zero line, and the short-term picture looks a lot less friendly than the weekly chart suggests. When these two signals line up together, it usually means sellers have grabbed the wheel for now, even if the destination further out remains unchanged.
What Traders Should Watch Next
Anyone eyeing an entry might want to have some patience here. A drop toward the 53 to 54 dollar zone could offer a better risk to reward setup for swing traders looking to buy the dip. The round number of 60 dollars is also worth watching, since psychological levels like that often produce a bounce even in a shaky market.
Should the range break down completely, the next real target on the chart sits closer to 32 dollars, lining up with that golden pocket mentioned earlier. Until that happens, most seasoned traders will likely treat this as a range to respect rather than a reason to panic.
Conclusion
The Hyperliquid price finds itself at an interesting crossroads as tlatform activity is thriving, with open interest at all-time highs, yet the token’s short-term chart is flashing caution. Longer term, the trend still leans bullish, and that golden pocket near 32 to 42 dollars remains the level patient investors are circling. Short-term traders, meanwhile, would do well to keep an eye on that 53 to 60 dollar zone before making any big moves.
Frequently Asked Questions
Why is the Hyperliquid price falling right now?
Selling pressure has picked up after the token broke below its mid-range support at 64 dollars, with money flow indicators showing capital leaving the market.
Does record open interest mean the price will rise?
Not necessarily. High open interest shows strong trading activity, but it does not guarantee upward price movement on its own.
What is the golden pocket in trading?
It is a Fibonacci retracement zone between the 61.8 percent and 78.6 percent levels, often seen as a high-probability area for a trend to resume.
Is Hyperliquid’s long-term trend still bullish?
Yes, based on the current chart structure, the broader uptrend from May remains intact despite the short-term pullback.
What could push the Hyperliquid price back above 64 dollars?
A reclaim of the mid-range support would likely need renewed buying volume and a bullish shift in the MACD, signaling that momentum has swung back in favor of buyers.
Glossary Of Key Terms
Open Interest: The total number of outstanding derivative contracts, such as futures, that have not been settled or closed.
Support Level: A price point where an asset has historically found buying interest strong enough to stop a decline.
Fibonacci Retracement: A technical tool that uses horizontal lines to identify possible support and resistance areas based on prior price swings.
Chaikin Money Flow (CMF): An indicator that measures buying and selling pressure over a set period by combining price and volume data.
MACD: Short for Moving Average Convergence Divergence, a momentum indicator that shows the relationship between two moving averages of price.