



Ethereum price has staged a notable comeback this week, gaining nearly 12% and briefly reigniting hopes among traders who had been waiting patiently on the sidelines.
Yet beneath that encouraging headline number sits a far less flattering story, one written in exchange flows, liquidation charts, and derivatives data that paint a picture of weakening conviction rather than a genuine turnaround. For anyone tracking the Ethereum price closely, the details matter more than the percentage gain itself.
What The Exchange Flow Data Actually Shows
Since mid-May, Glassnode’s exchange net position figures for Ethereum had remained firmly negative, meaning more coins were leaving exchanges than arriving. That pattern usually signals holders tucking their assets away in cold storage, a classic sign of long-term confidence. On July 5, though, that trend flipped into positive territory.
Coins started flowing back onto exchanges in noticeable volume, and history suggests that when large holders move funds toward trading platforms, they are often positioning to sell rather than to hold. It does not spell doom immediately, but it is the kind of shift that makes seasoned traders raise an eyebrow.
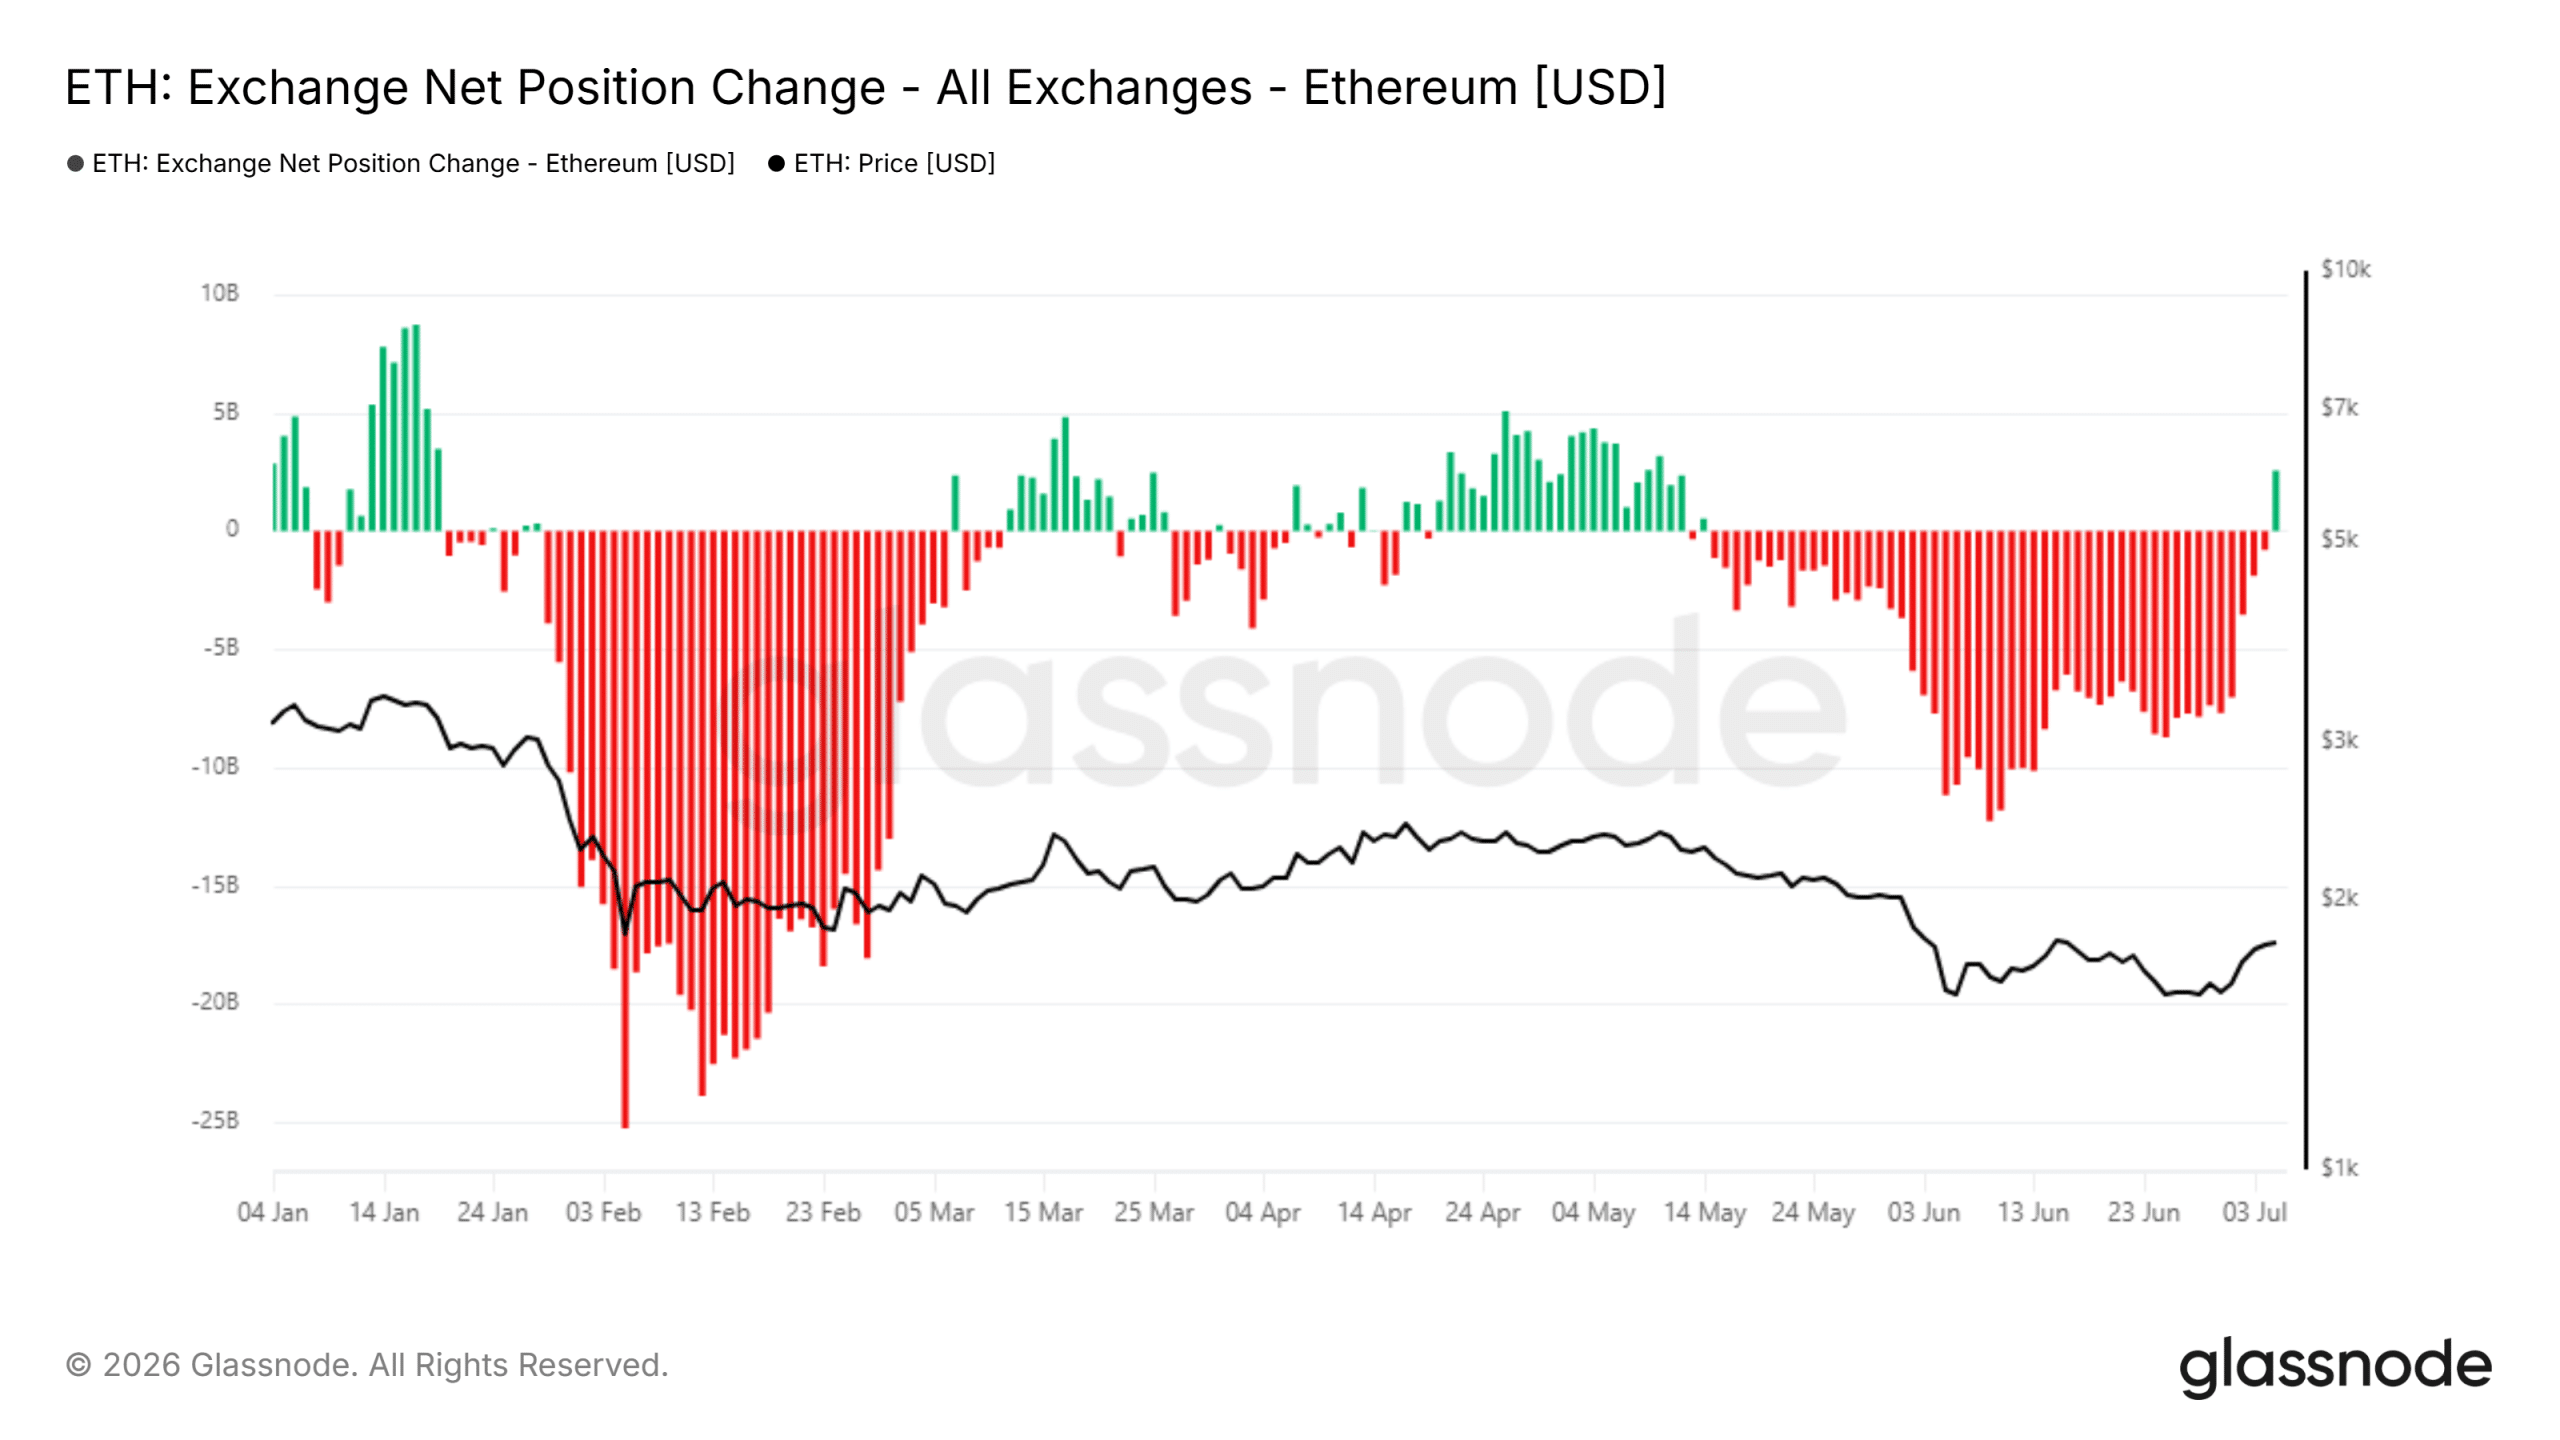
The Ethereum price rally, in other words, might be running on borrowed time. Bitcoin’s failed attempt to clear resistance near 64,000 dollars dragged the broader market down with it, and Ethereum price slipped below 1,800 dollars shortly after bulls had been eyeing a push toward the 2,000 dollar mark. A monthly TD Sequential buy signal had fueled some of that optimism, yet the follow-through simply never showed up.
Ethereum Price: Open Interest And Liquidations Tell A Cautionary Tale
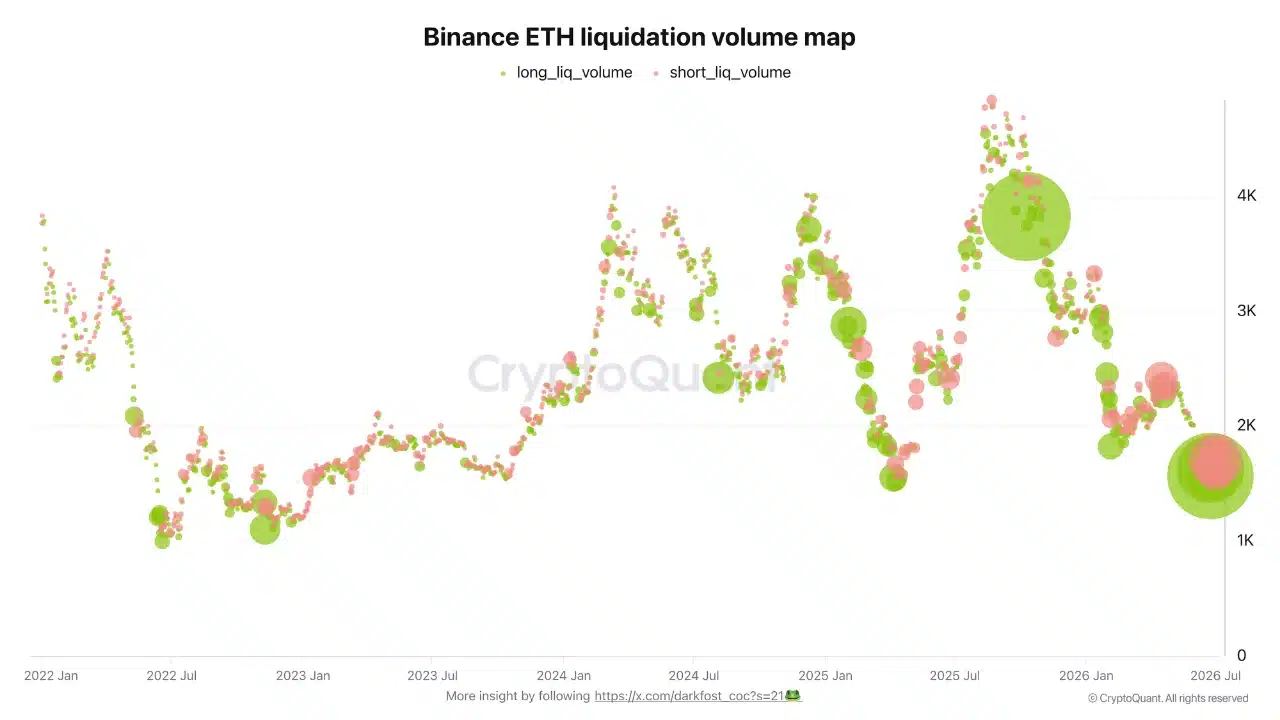
Open interest in Ethereum derivatives has fallen sharply, dropping from a peak of 33.9 billion dollars back in October 2025 to roughly 11.2 billion dollars now. That is a steep decline, and it usually reflects traders pulling back from leveraged positions altogether rather than rotating into fresh ones. CryptoQuant’s liquidation map backs this up, showing a wave of long liquidations in late June that came close to matching the intensity of October’s selloff.
There is a silver lining buried in the numbers, at least on paper. Short sellers got squeezed hard this month, with over 300 million dollars in short positions liquidated as the Ethereum price pushed higher. But most analysts view this as forced buying rather than organic demand, the kind of squeeze that clears out overleveraged shorts without actually bringing new buyers into the fold. Once those shorts are gone, the upward pressure they created tends to fade just as quickly as it appeared.
The Coinbase Premium Keeps Flashing A Warning
Another indicator worth watching closely is the Coinbase Premium Index, which measures the price difference between Coinbase and other global exchanges. A positive reading typically points to strong buying interest from American investors, while a negative one suggests the opposite.
This metric has stayed in negative territory since late April, and it has not budged much even as the Ethereum price approached 1,800 dollars again. That absence of US-driven demand is a notable gap, especially given how influential American capital tends to be during genuine bull phases.
Holder Behavior Points To Distribution, Not Accumulation
Perhaps the most telling metric of all is the holder accumulation ratio, which tracks whether active wallet addresses are net buyers or net sellers over time. This figure has been sliding steadily since May, and it has not reversed course despite the recent bounce.
That decline suggests the market is still working through a distribution phase, with existing holders trimming positions rather than adding to them. When accumulation dries up while price still manages a bounce, it usually means the rally is being carried by short covering and thin liquidity rather than fresh conviction.
Conclusion
Taken together, these signals suggest the current Ethereum price bounce has more in common with a short squeeze unwinding than a durable trend reversal. Exchange inflows are rising, open interest keeps shrinking, American demand remains muted, and holders appear to be distributing rather than accumulating. None of this guarantees an immediate reversal, but it does mean the rally deserves a healthy dose of skepticism until the underlying data starts telling a more convincing tale.
Frequently Asked Questions
Is the Ethereum price rally sustainable?
Current on-chain data suggests weak footing, with distribution signals outweighing accumulation trends.
What does rising exchange inflow mean?
It often signals holders preparing to sell, since coins typically move to exchanges before being traded.
Why did short sellers lose money this month?
A sudden price bounce forced leveraged short positions to liquidate, creating temporary upward pressure.
Does falling open interest matter?
Yes, it shows traders are reducing exposure rather than building new positions, reflecting caution.
Glossary Of Key Terms
Exchange Net Position: The net flow of a cryptocurrency onto or off exchanges over a given period.
Open Interest: The total value of outstanding derivative contracts that have not been settled.
Liquidation: The forced closing of a leveraged trading position due to insufficient margin.
Coinbase Premium Index: A metric comparing Ethereum’s price on Coinbase against other global exchanges.
Accumulation Ratio: A measure of whether wallet addresses are net buying or net selling an asset.
Disclaimer: This article is for informational purposes only and does not constitute financial advice.