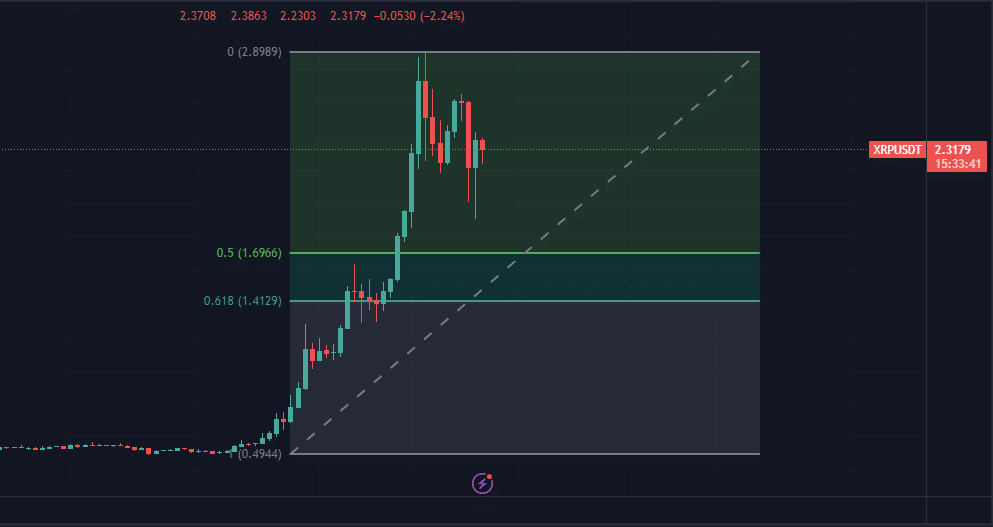
The native cryptocurrency for Ripple, XRP, has seen its first bearish correction since its bullish rally started in November. After hitting an eight-month high earlier this month, the digital asset has been on a major retreat as profit-taking has taken over market activity. As such, this correction has pinpointed important price levels that traders must watch closely going forward.
Recent Price Action and Fibonacci Secrets
On December 3, XRP reached $2.90 before pulling back 20% to a weekly low of $1.90. In the wake of this, the cryptocurrency recovered partially and was trading at $2.31 at the time of writing. Fibonacci indicators have mapped out retracement potential levels ranging from $1.41 to $1.69.

Source: TradingView
If this downtrend is to continue, XRP may find support within this retracement range. Whether the cryptocurrency will continue to drop or consolidate largely relies on the market around these levels. Though the broader selloff exists, some investors are cautiously optimistic with the slight resurge from the weekly low.
Spot Flow Trends versus Demand Dynamics
Instead, XRP’s trading activity in the spot market sees its demand in supply in constant flux. At the time, spot inflows experienced a peak on December 1, as 177.33 million XRP flowed into the market as buying strengthened. But from December 4 on, outflows started ruling the flow, reaching 155.79 million XRP, right in line with a price drop.

Source: Coinglass
For the last 10 days, we have consistently had a situation where outflows displaced inflows, demonstrating a weakening of the bullish sentiment. Also, the latest inflow figure of $11.35 million on December 10 is far less than previously. The shift higher in spot flows suggests further downside is likely unless demand picks up quickly.
Further bearish sentiment is indicated in the Derivatives Market
XRP, too, reflects a cautious outlook in its derivatives market activity. According to Coinglass data, negative funding rates were on a noticeable climb on December 11 — a sign of increasing short-selling activity. Traders’ waning bullish enthusiasm is evident from a decline in positive funding rates.

Source: Coinglass
The cooling of demand in the spot market is reflected in a corresponding rise in bearish positions in the derivatives market. Rising expectations of a price decline typically lead to negative funding rates, which may reinforce downward pressure. However, the mood could change suddenly due to market events or liquidity-induced volatility.
Key Levels to Watch and Volatility
This recent pullback indicates XRP is more vulnerable to volatility than other coins, with liquidations causing Tuesday’s trading session to swing wildly. Market participants are finding it hard to understand the changing sentiment, and hence, the potential for extreme price swings is high. Traders should watch key support levels near $1.41 and $1.69, at which Fibonacci retracement comes into play.
On the other hand, a new breakout above the $2.50 mark can trigger a renewed bull rally. Market watchers should also monitor demand-inducing factors (for instance, regulatory changes and institutional interest) that may otherwise impact the current track.
It will largely depend upon the demand and supply forces during the coming days. The cryptocurrency’s fortunes will ride on the interplay between spot flows, public sentiment on derivatives markets, and broader market conditions.


