Bitcoin’s (BTC)price extended its losing streak on Monday, dropping below $82,000 as market anxiety escalated. Ever since reaching its highest point of $88,400 at the start of March, Bitcoin has experienced a more than 7% price drop. The combination of international power struggles and expected United States trade policy changes put pressure on conventional financial assets and crypto markets.
The broader digital asset market followed Bitcoin’s lead, with global crypto capitalization slipping to $2.65 trillion. The recent downtrend forced traders to sell their crypto assets worth more than $220 million. Macroeconomic indicators remain weak, while current tariff uncertainty heightens market risk avoidance.
All market participants watch when former President Donald Trump delivers his April 2nd “Liberation Day” speech to broadcast major tariff policy news. The predicted impact of these measures consists of damaging worldwide trade operations alongside potential inflationary effects. Concerns about rising market ambiguity lead investors to abandon all risky assets, including cryptocurrencies.
Bitcoin Faces Mounting Pressure Amid Weak Technicals
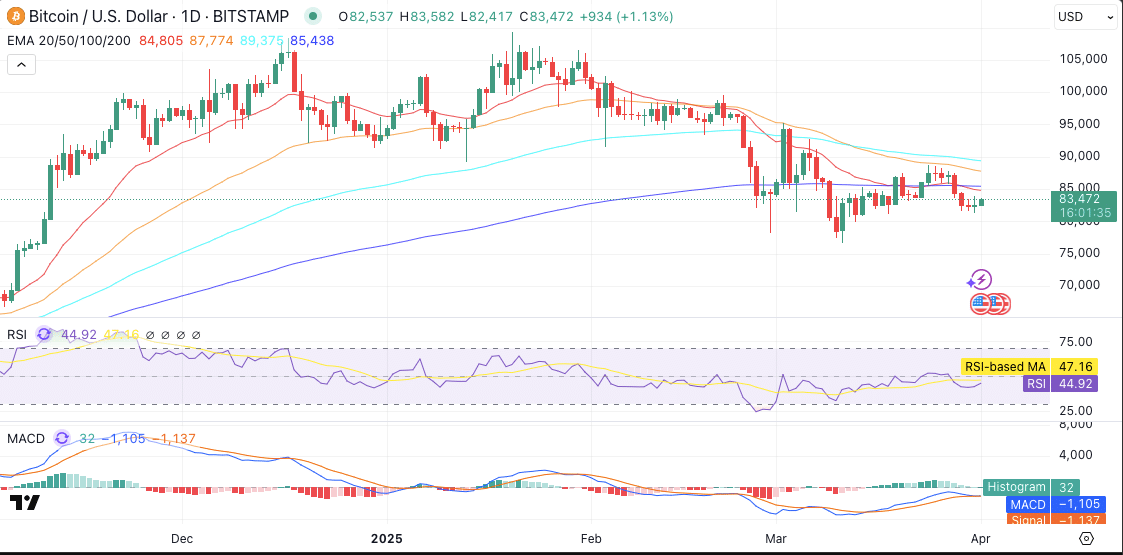
Bitcoin is trading at approximately $81,800, reflecting a continued downtrend from its late March highs. The current market sentiment remains negative because Bitcoin’s prices remain below significant exponential moving averages. Traders maintain a weak upward potential as sellers dominate recent market activity.
Bitcoin trades below its 20-day EMA at $84,805, its 50-day EMA at $87,774, and its 100-day EMA at $89,375. The price has failed against the strong resistance level at $85,438, representing the 200-day EMA. Such bearish price patterns indicate minimal upward movement needs substantial buying strength.
The current Relative Strength Index (RSI) indicator shows 44.92 points while indicating mild bearish pressure against neutral market momentum. The MACD indicator displays its MACD line positioned at -1,105 points under the signal line that resides at -1,137. The negative area of the histogram provides evidence that buying momentum declines while investors demonstrate weak interest in purchases.

Bitcoin’s price continues to test the $80,000 support zone, where liquidation risk increases. A price unable to sustain a position above this level has the potential to speed up selling activities. A breakdown could push Bitcoin toward the lower channel around $73,000, a key cyclical support level.
Global Markets Brace for Policy Shock as Altcoins Slide
Recent downturns in cryptocurrency markets follow the overall weakening of financial markets because of worldwide policy uncertainty. March has caused severe declines in stock market values for the S&P 500, Nasdaq, and Dow Jones. The market downturn in digital assets shows evidence of matching traditional market fluctuations, thus confirming their relationship with mainstream financial markets.
The current market correction period has severely affected all cryptocurrencies, leading investors to doubt the digital asset space. Market value has dropped 1.4% to reach $57 billion, while participation levels indicate a decrease. This volume drop underlines hesitation among retail and institutional investors.
Market players are cautious because traders expect decisions from the U.S. about potential trade tariffs that might lead to responses from foreign partners. Market experts believe that mutual trade actions will lead to increased market volatility. Increasing trade tensions will reduce economic development while boosting prices, thus intensifying investor apprehension.
Gold Rises as Safe-Haven Assets Outperform Crypto
The price of gold reached new unprecedented heights exceeding $3,087, as investors started showing more interest in conventional lifeboat assets. This trend contrasts sharply with Bitcoin’s poor quarterly performance, down 13% in Q1 2025. The asset’s division from gold indicates its specific designation as a risk-on investment.

The market value of gold has risen because investors face increasing economic unpredictability. Goldman Sachs predicted the likelihood of a global recession would reach 35 percent. People who invest money now choose assets that do not move similarly to what economists consider a volatile market. This shift adds to downward pressure on Bitcoin and other digital assets.
Worsening global trade disturbances will likely drive increased demand for safe-haven assets while simultaneously reducing crypto assets’ popularity. Technical patterns for Bitcoin suggest limited upside unless buyers regain control. The current macroeconomic conditions appear likely to challenge digital assets before they can find stability.
FAQs
Why has Bitcoin dropped below $82,000?
Bitcoin dropped due to rising trade tensions, weak economic data, and consistent selling pressure amid broader market volatility.
What is “Liberation Day” and how does it impact crypto?
Liberation Day refers to Trump’s expected tariff announcement, which could impact investor sentiment and global risk assets, including crypto.
Is Bitcoin still correlated with traditional markets?
Yes, Bitcoin’s recent movements mirror equity market losses, highlighting its ongoing correlation with broader financial trends.
What are the key support and resistance levels for Bitcoin?
Key support is around $80,000, while resistance stands near the 200-day EMA at $85,438 and beyond at $90,000.
Are other cryptocurrencies also falling?
The entire digital asset market has declined, with major altcoins posting losses alongside Bitcoin.
Glossary of Key Terms
EMA (Exponential Moving Average): A technical indicator showing the average price over a set period, giving more weight to recent prices.
RSI (Relative Strength Index): A momentum indicator measuring the speed and change of price movements, typically used to identify overbought or oversold conditions.
MACD (Moving Average Convergence Divergence): A trend-following momentum indicator that shows the relationship between two moving averages.
Support Level: A price point where a downtrend can be expected to pause due to a demand concentration.
Resistance Level: A price point where a rising market can be expected to pause due to a concentration of selling interest.


