In one of the most dramatic sell-offs of 2025, Mantra’s OM token plunged over 90% in just a few hours — wiping out billions in market capitalization and sparking widespread panic across the crypto ecosystem. While many investors were left scrambling for answers, new on-chain data and official statements are beginning to reveal the full picture behind the collapse.
- OM Drops from $6 to $0.50 in Hours
- Mantra (OM)’s Price Snapshot (April 14, 2025)
- On-Chain Data Shows Panic, Not a Pre-Planned Dump
- Holder Concentration Remained High
- Was It a Rug Pull? Team Says No
- Conclusion
- FAQs
- What caused the OM token crash?
- Did the Mantra team sell their tokens?
- Is OM recovering after the crash?
- Glossary of Key Terms
OM Drops from $6 to $0.50 in Hours
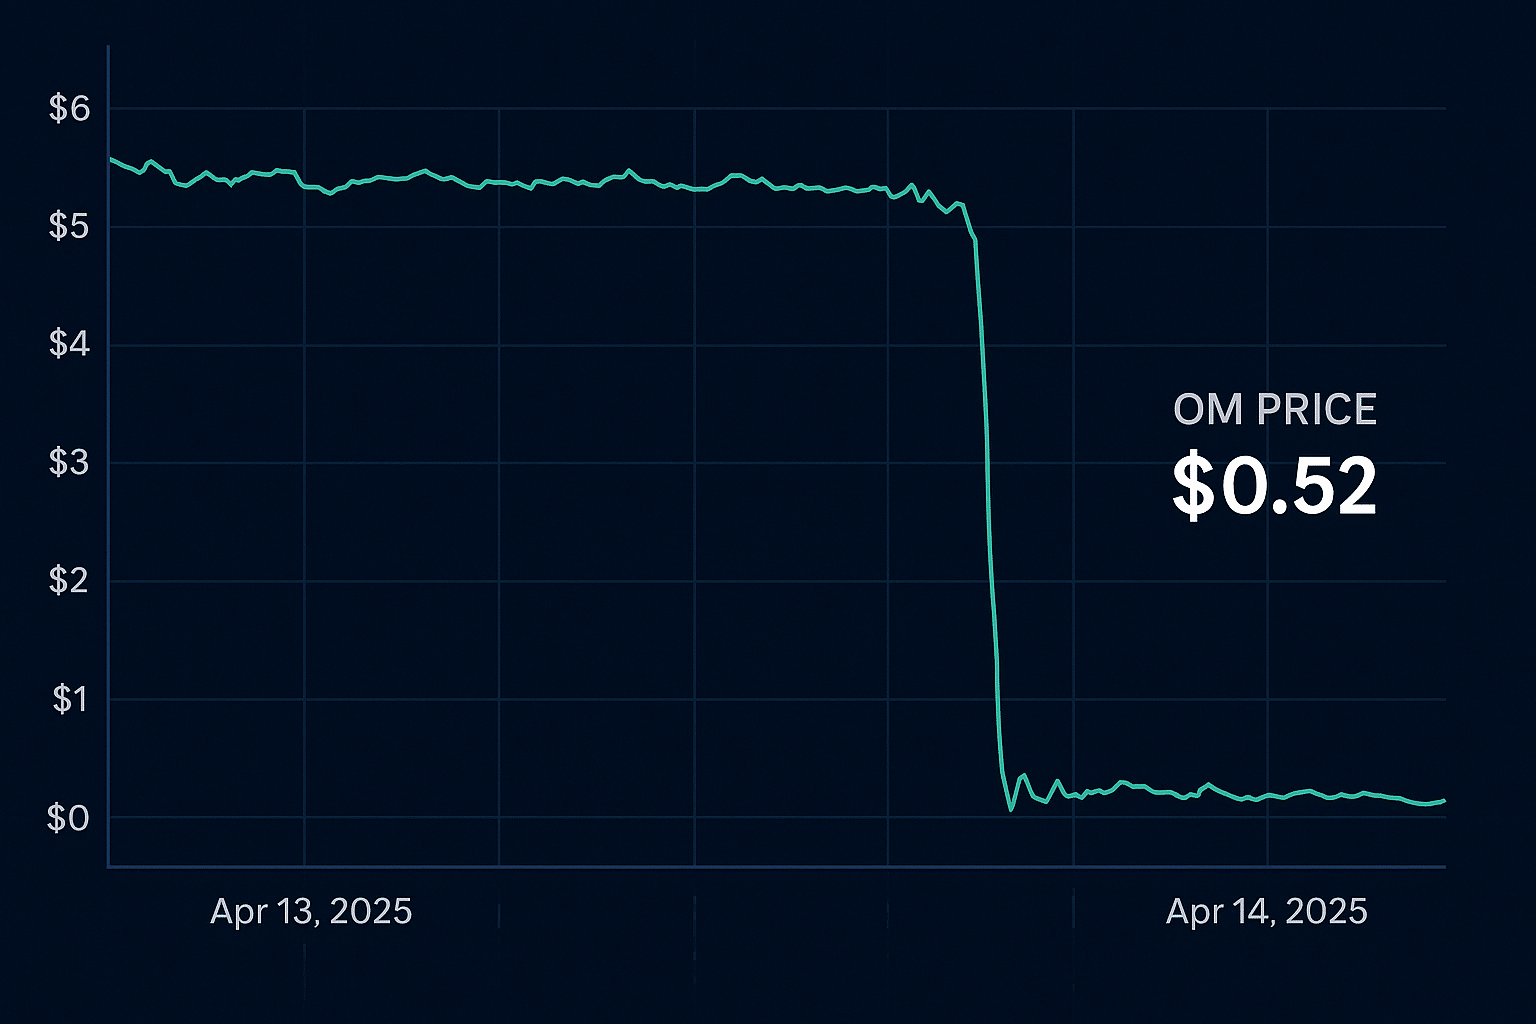
On April 14, 2025, Mantra (OM)’s price plummeted from just above $6 to nearly $0.50, triggering a chain reaction across exchanges and wallets. The crash was so swift that over $5 billion in value was erased in under six hours.
According to on-chain analytics firm Glassnode, there were no signs of pre-emptive exchange inflows before the drop — an unusual observation in major drawdowns, where whales often move tokens to exchanges ahead of major sell-offs.
“Unlike typical pre-crash behavior, the largest OM inflows occurred after the crash had already begun,” Glassnode noted in a report. “That suggests the sell-off was driven by panic rather than insider action.”
Mantra (OM)’s Price Snapshot (April 14, 2025)
| Metric | Value |
|---|---|
| Current Price | $0.52 |
| 24-Hour Change | -91.4% |
| Market Cap | $139 million |
| 24-Hour Trading Volume | $422 million |
| Circulating Supply | 267 million OM |
On-Chain Data Shows Panic, Not a Pre-Planned Dump
The first significant influx of OM to centralized exchanges came at 08:20 UTC on April 14 — when the token had already crashed to $0.71. Approximately 38 million Mantra (OM) tokens were transferred at that time, indicating a reactionary sell-off by retail users and short-term holders rather than a coordinated insider move.
In the same window, active addresses on the network surged to 574, and token transfers peaked at 1,400 within 10 minutes, highlighting the mass panic among investors.
“This wasn’t a rug pull — it was a cascade of fear-driven exits and liquidations,” said crypto market analyst Daria Chen. “Once OM started falling, everyone rushed to the exits.”
Holder Concentration Remained High
One of the more controversial insights came from the concentration of Mantra (OM) supply. Before the crash, the top 1% of addresses controlled 96.4% of OM’s circulating supply — a concentration that only marginally fell to 95.6% post-crash.
This indicates that major holders largely held their positions, and smaller holders and retail investors bore the brunt of the collapse. OM’s realized capitalization, or the total cost basis of holders, fell by $740 million in less than 9 hours, according to Glassnode.

Was It a Rug Pull? Team Says No
Speculation quickly spread across social media that the MANTRA team orchestrated a dump, drawing parallels to the infamous LUNA collapse of 2022. However, co-founder JP Mullin quickly addressed the rumors.
In a statement, Mullin clarified:
“The crash was triggered by a forced liquidation of a large Mantra (OM) position on a centralized exchange. Our team tokens remain locked under the published vesting schedule.”
Despite the official denial, the situation has raised critical questions about OM’s tokenomics and transparency, particularly the outsized token control attributed to the development team.
Conclusion
The collapse of Mantra (OM) highlights a painful reality in crypto: trust can vanish in minutes, and even fundamentally sound projects can be caught in downward spirals. While the Glassnode data suggests the crash wasn’t a coordinated exit, the extreme centralization of OM supply and lack of prior warning contributed to the shockwave.
Whether OM can recover from this crisis will depend on the team’s transparency, market response, and technical recovery. For now, it stands as a stark reminder of crypto’s enduring volatility.
FAQs
What caused the OM token crash?
The collapse was triggered by a forced liquidation of a large OM holder’s position, which led to mass panic selling across the market.
Did the Mantra team sell their tokens?
No. The team clarified that all tokens remain locked and are subject to a vesting schedule, denying any insider sell-off.
Is OM recovering after the crash?
As of now, OM is trading at $0.52. While some buyers are returning, investor sentiment remains cautious.
Glossary of Key Terms
Forced Liquidation:
Automatic closing of a leveraged position due to insufficient collateral, often triggering steep price drops.
Realized Capitalization:
A metric estimating the aggregate cost basis of holders based on the price when each token was last moved.
Exchange Inflow:
The total amount of tokens transferred to centralized exchanges — often a signal of potential selling pressure.
Holder Concentration:
A measure of how much of a token’s supply is held by a small number of addresses. High concentration increases risk.
Active Addresses:
The count of unique addresses participating in token transactions — often used to gauge market activity and sentiment.


