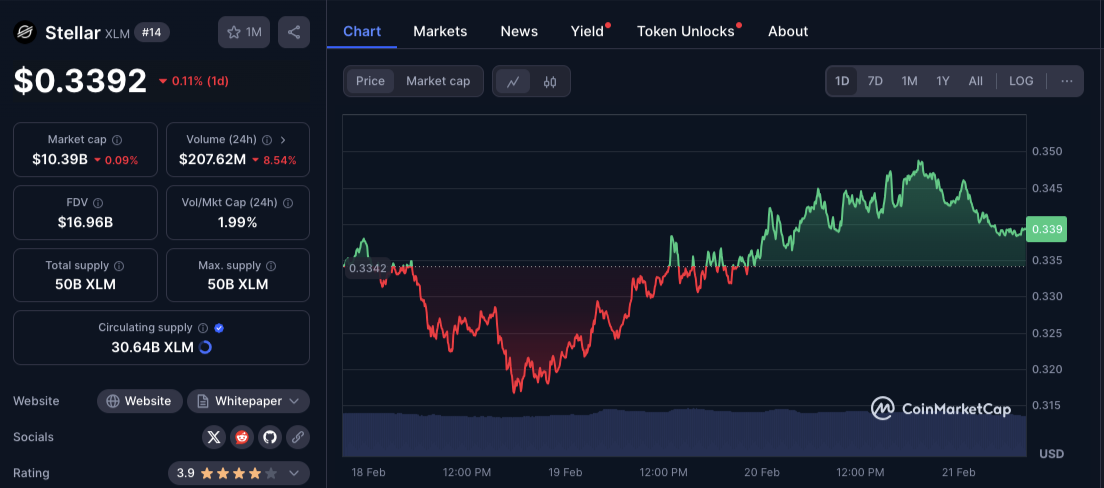
As the market stabilizes, Stellar (XLM) is showing signs of life and investors are wondering if it can rally to $0.40. At the moment, XLM is trading at $0.33 and the indicators are hinting at a bullish turn. With a focus on the Stellar price prediction, we will go deep into Stellar’s current performance, key resistances and market dynamics that can propel a breakout. We will see if XLM can overcome the short-term hurdles and deliver on the promise of a sustained rally.
Current Market Overview
Stellar has had a mixed week, prices have been moving between $0.320 and $0.360. Recently, XLM’s recovery has been with modest volume, and a series of technical signals suggests a reversal of the short-term trend. But the journey to $0.40 is not guaranteed, $0.360 is the key resistance.
The broader crypto market, influenced by Bitcoin and overall sentiment, plays a big role in determining Stellar’s path. Investors are watching these macro trends along with Stellar’s indicators to see if there will be a breakout.

Technical Signals: Indicators and Trends
Technical analysis is mixed but cautiously optimistic for Stellar. Here are the key indicators that shape the Stellar price prediction:
– Moving Averages:
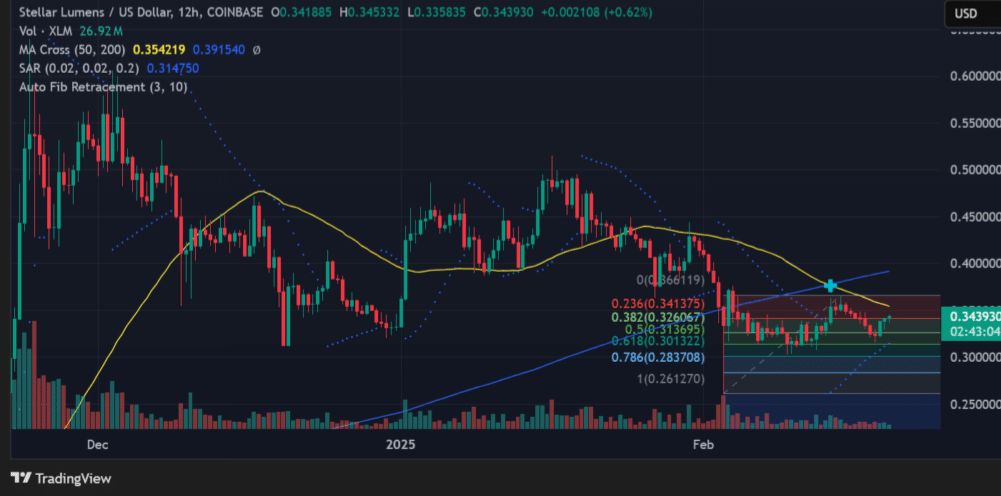
The recent crossover of the 50 day and 200 day MAs suggests trend changes. Although a bearish crossover happened recently, if the price recovers the 50 day MA (around $0.354) it could be the start of an uptrend.
– RSI (Relative Strength Index):
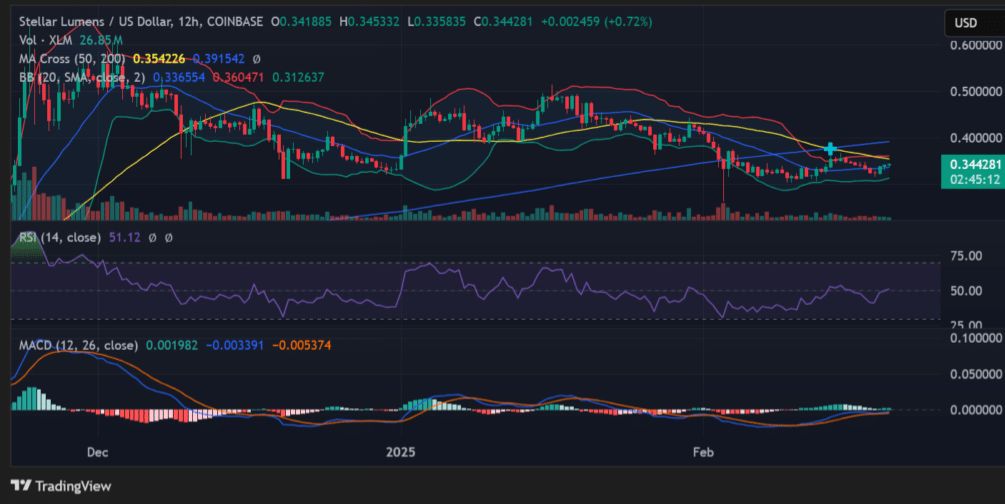
With an RSI of 51.12 Stellar is neutral. But if it goes above 60 it could be stronger bullish momentum and support the “Stellar price prediction” for a rally.
– MACD (Moving Average Convergence Divergence): MACD is showing a bullish crossover as the MACD line is above the signal line. If this continues and the histogram is green it will support the price surge.
– Bollinger Bands:
Stellar is currently around the middle band (SMA 20) at $0.336. If XLM breaks above the upper Bollinger Band at $0.360 it will be an upside breakout.
– Fibonacci Retracement:
Key retracement levels are important in the “Stellar price prediction”:
- 23.6% retracement at $0.341 is the current price zone.
- 38.2% retracement at $0.326 is the support zone.
- 61.8% retracement at $0.301 is the major support.
A break above $0.360 will open the door to $0.380 to $0.400.

Deep Analysis: Can XLM Hit $0.40?
At the heart of the price prediction debate is whether XLM can get past its short term resistance at $0.360 and keep the momentum. Several factors to consider:
– Breakout:
If Stellar can break above the upper Bollinger Band and hold above the 50 day MA, it will confirm the bullish signal from the MACD crossover. A breakout would mean a move to $0.380-$0.400. If it can’t hold above $0.320, it could retest the lower fib levels of $0.300-$0.283.
– Volume and Momentum:
Moderate volume (26.85M) means traders are cautious. A big volume up with RSI and MACD improving would be a good sign for the price prediction.
– Broader Market:
Stellar’s performance is not isolated. Bitcoin and overall market sentiment and macro factors will affect XLM. If the market goes bullish it will support XLM’s climb.
– Investor Behavior:
Historical pattern shows once technical resistance is broken, retail and institutional investors will drive the momentum. But meme coins and altcoins are also volatile so any rally might not be sustained if not backed by fundamental improvements in the network.

Key Metrics and Market Data
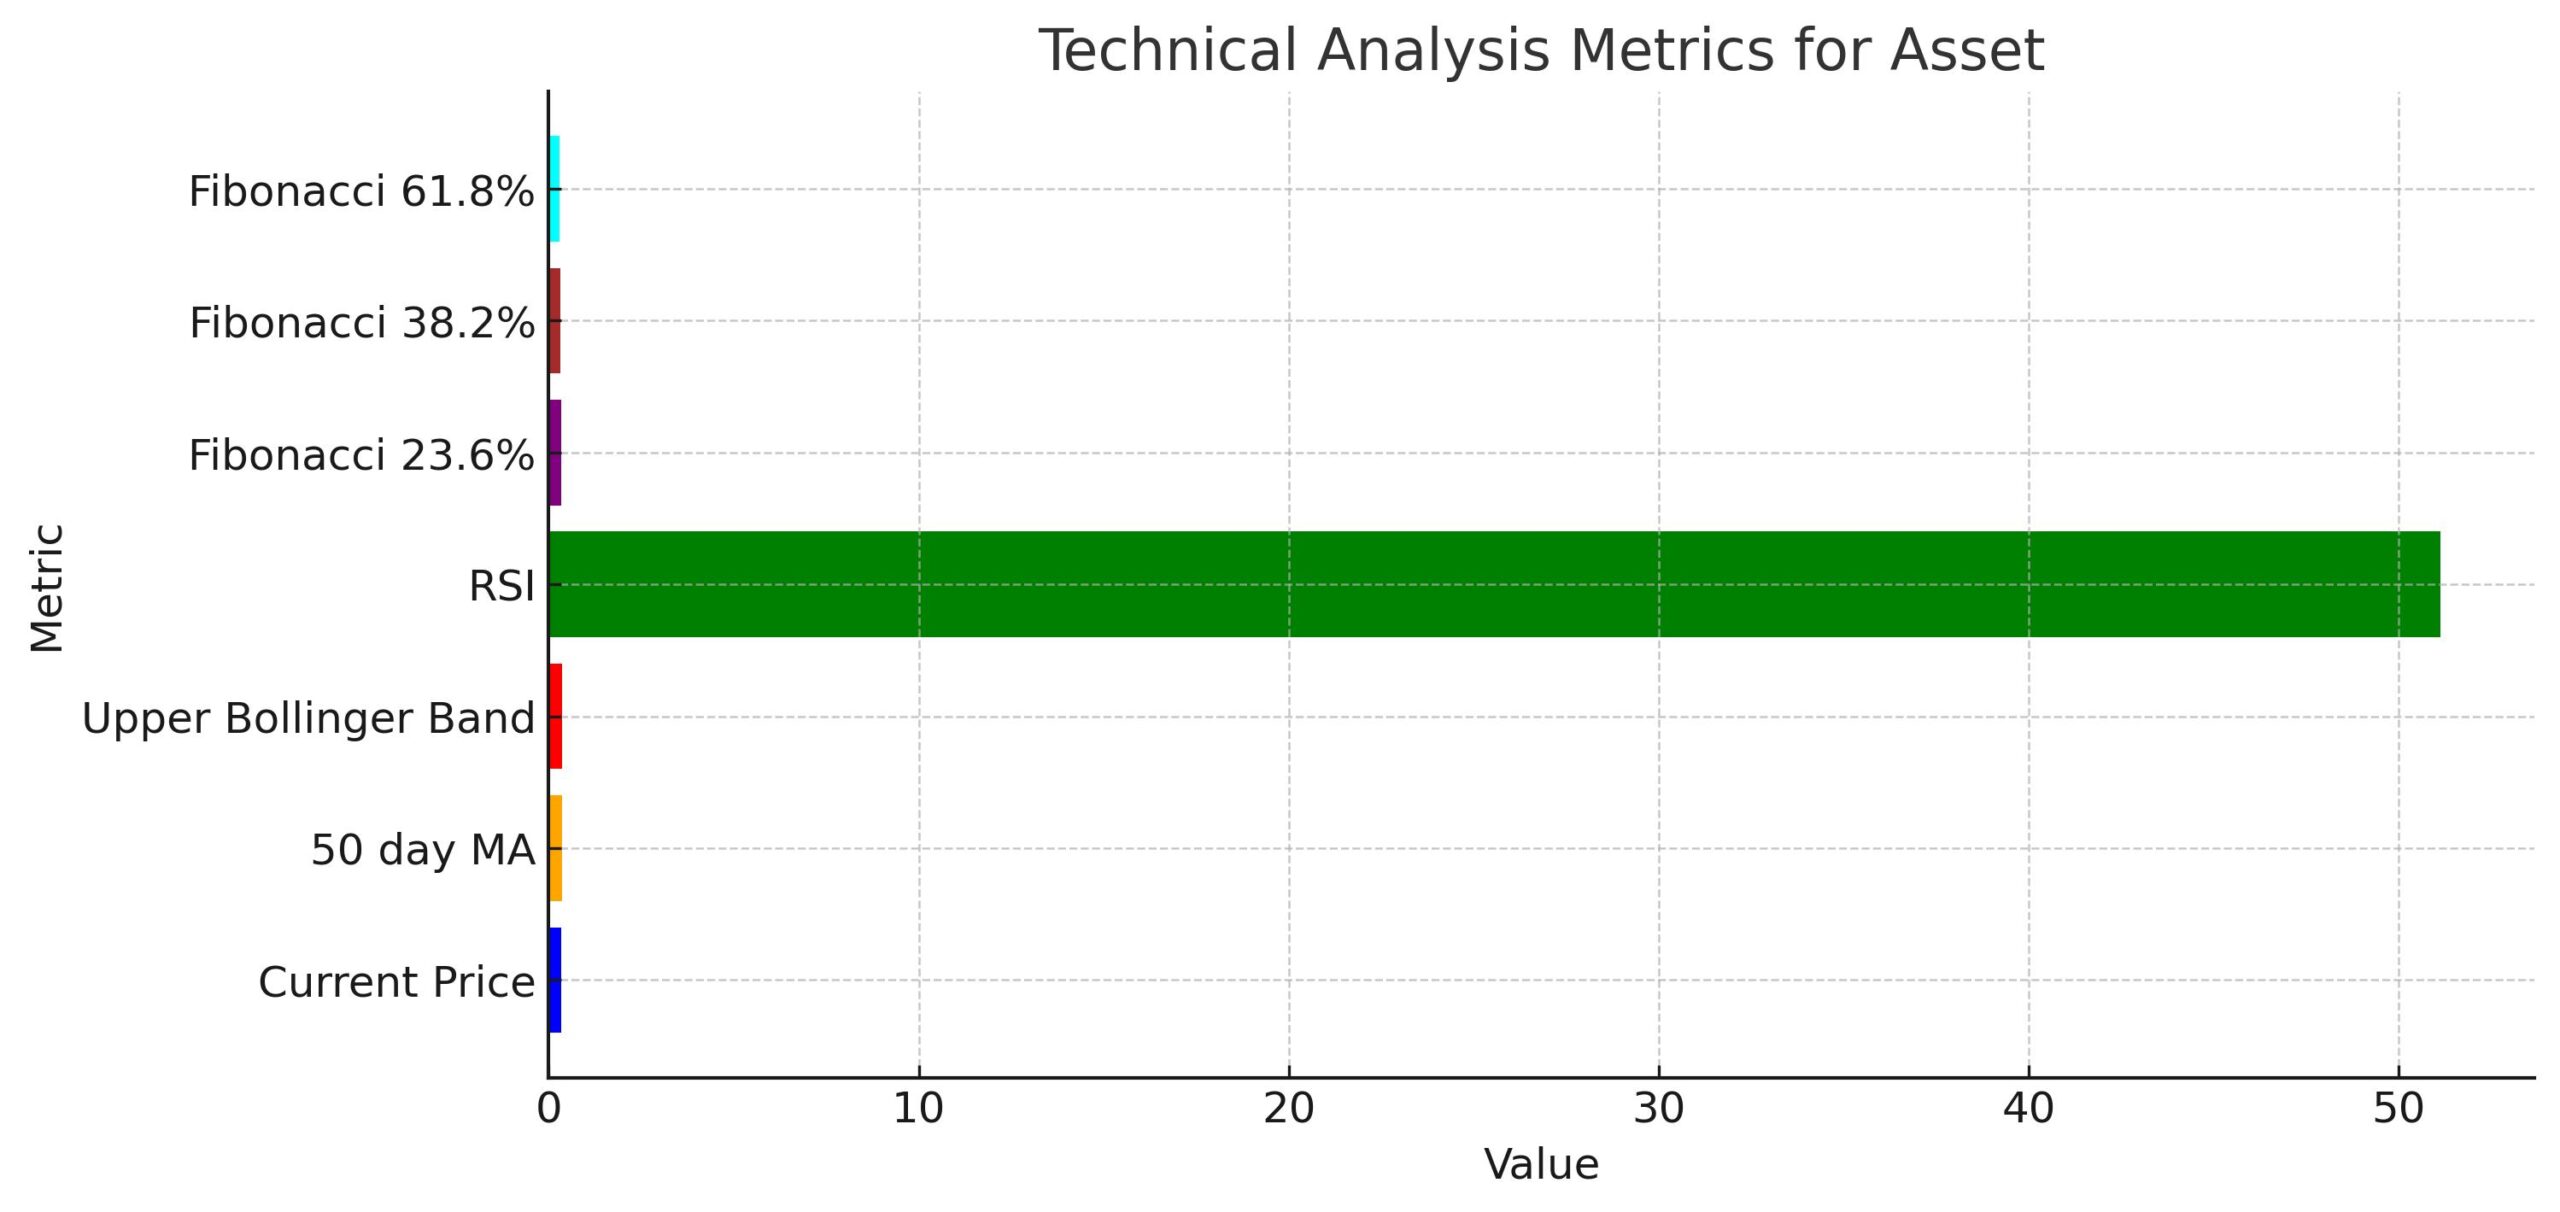
Here are the key technicals for the price prediction:
Metric | Value | Meaning |
Current Price | $0.344 | Recovering |
50 day MA | ~$0.354 | Level to reclaim for a bullish signal |
Upper Bollinger Band | ~$0.360 | Resistance level; break could trigger upside breakout |
RSI | 51.12 | Neutral; above 60 means bullish momentum |
Fibonacci 23.6% | $0.341 | Current price region |
Fibonacci 38.2% | $0.326 | Support area |
| Fibonacci 61.8% | $0.301 | Major support |
This data supports the “Stellar price prediction” that a break above $0.360 could mean a move to $0.40 if the overall market improves.

Market Sentiment and Broader Factors
Stellar is recovering as the market sentiment is shifting. Analysts say the current moderate recovery is due to several factors:
– Bitcoin:
Bitcoin is the gauge for the entire crypto market. If it breaks above the resistance and goes bullish, altcoins like Stellar will follow.
– Regulatory Clarity:
With increasing clarity in crypto regulations especially in major markets like the US, investor confidence is improving. This regulatory clarity could spill over to altcoins including XLM.
– Global Economy:
Macro conditions such as inflation and monetary policy adjustments are still playing a role. A good economic environment will support the recovery of digital assets.
Conclusion
The Stellar price prediction for a rally to $0.40 is backed by multiple technical indicators and good market signals. At $0.33 currently, Stellar is at a crossroads: a breakout above $0.360 could trigger a move to $0.380-$0.400 with RSI and MACD momentum. Failure to hold support could lead to a retest of lower Fibonacci levels.
While the broader market conditions (Bitcoin, regulations, global economy) will impact Stellar, the current setup is bullish. Investors should watch volume and key support and resistance levels to see if Stellar can hold on and reach the target price.
Stay updated with Deythere as we’re available around the clock, providing you with updated information about the state of the crypto world.
FAQs
1. What is the current price of Stellar (XLM)?
Stellar is at $0.33, recovering.
2. What technical indicators support the Stellar price prediction?
50day MA, RSI 51, MACD crossover, Bollinger Bands. A break above the upper band at $0.360 could be the way to $0.40.
3. What are the Fibonacci retracement levels for Stellar?
23.6% at $0.341, 38.2% at $0.326 (support), 61.8% at $0.301 (major support). Above $0.360 could be $0.380-$0.400.
4. How will broader market conditions impact Stellar?
Bitcoin, regulations, global economy will impact Stellar’s recovery and the chance to $0.40.
5. What are the risks if Stellar fails to break through resistance?
If Stellar can’t hold above $0.320, it will retest Fibonacci support zones between $0.300 and $0.283 and stall the recovery.
Glossary
Stellar price prediction: The price forecast of Stellar (XLM) based on technical and market analysis.
MA: Moving Average. A technical indicator that smooths out price data for a certain period.
RSI: Relative Strength Index. A momentum oscillator that measures the speed and change of price movements. Above 60 is bullish.
MACD: Moving Average Convergence Divergence. A trend following momentum indicator that shows the relationship between two MAs.
Bollinger Bands: A technical analysis tool that measures volatility and provides upper and lower price boundaries.
Fibonacci Retracement: A tool to identify potential support and resistance levels based on the Fibonacci sequence.
Resistance: A price level where selling will be strong enough to prevent the price from going up.
Support: A price level where buying will be strong enough to prevent the price from going down.
Disclaimer
This article is for information purposes only and not for trading or investment advice. Please do your own research and consult with a professional before making any decisions based on the info provided.


![BitTorrent [New]](https://s2.coinmarketcap.com/static/img/coins/64x64/16086.png)


