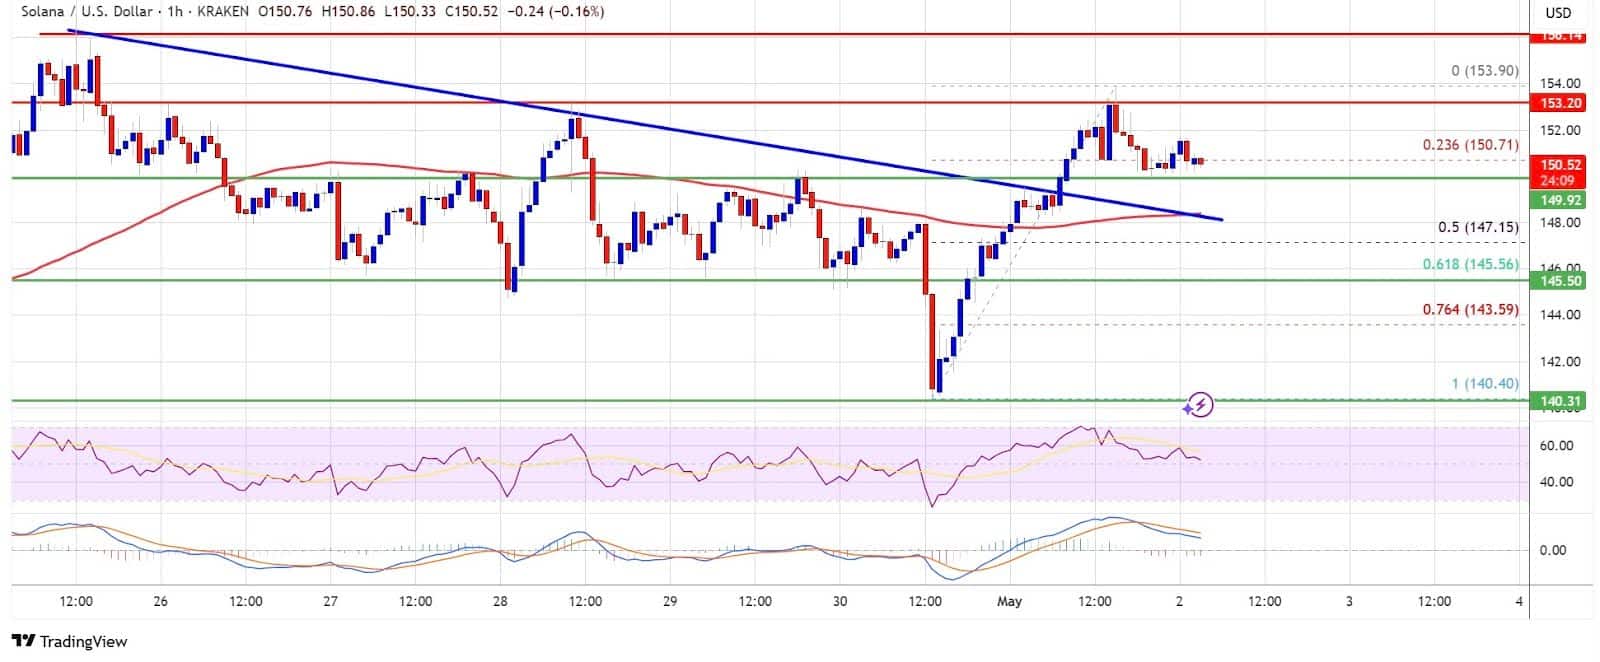
Solana is back in the spotlight as it breaks near $150, showing signs of strength after consolidating at $140. With bullish technicals and growing ecosystem support, traders are watching the charts for the next move. This rally has sparked interest in the Solana price prediction, especially with resistance at $154 and $158 now being tested.
SOL Holds Near $150: Strong Base or Short-Term Hype?
The trend shows SOL has a solid base above $140, then a clean break above $145 and $149. Kraken data shows a key bearish trend line was broken at $149, opening up to $154. At the moment, SOL is trading $148-$150, above its 100-hour SMA.
According to CoinMarketCap, Solana’s 24-hour volume is above $2 billion, with its market cap above $70 billion. This volume has been keeping the support levels intact. IntoTheBlock data shows whale accumulation is increasing, with large transactions up 15% in the last 48 hours.

$154 in Sight: Will Solana Continue to Rally?
If SOL holds above $15o and breaks $154, the next level is $158. A sustained move above $158 could take it to $165 and possibly $180 in the near term. This would align with the broader altcoin recovery as Bitcoin hovers around $96k.
Technicals are bullish. The hourly MACD for SOL/USD is building momentum and the RSI is above 50. This means strong buying interest if the macro stays steady and no volatility shocks the market.
However, traders are to be cautious. Solana has shown good momentum, but if the market turns or Bitcoin drops, SOL could face resistance.
Pullback Risk: How Deep Could SOL Retract?
Even with the momentum, a failure to break above $154 could lead to a short-term pullback. Immediate support is at $150, then $147. A drop below that would take SOL to $145, which is the 50% Fibonacci retracement of the $140 to $154 move.
A close below $145 would be a clear reversal and would take prices back to the $140 support. For now, SOL is just consolidating gains rather than showing a trend break.
Why Solana’s Momentum Isn’t Just Technical
Beyond charts, Solana’s price is backed by fundamentals. The network is still getting developer activity and new apps, especially in DeFi and NFTs. Last month, Solana-based decentralized exchange Jupiter surpassed Uniswap in trading volume, a big milestone that shows growing on-chain demand.

Plus the Solana Foundation’s recent grants to improve validator decentralization and network reliability have given investors more confidence. The growing interest in building on Solana and the network’s speed are starting to show up in price, some analysts have aired in a recent market note.
Google Trends also shows a steady increase in searches for Solana price prediction as the altcoin approaches key breakout levels.
The Bottom Line: Breakout or Fade?
SOL is trading just below a key resistance at $154 and the technicals are in favor of the bulls. The next few days will determine if Solana continues to rally or pull back deeper. Strong volume and network growth are good signs but keep an eye on Bitcoin and macro factors that will impact risk appetite.
For now, the bias is cautiously bullish, but only a confirmed breakout above $158 will validate the next leg to $165 and beyond.
FAQs
What is the current Solana price prediction?
SOL is trading around $15o. If it breaks $154 and $158, the next targets are $165 and $180. If it fails, support is at $150 and $145.
Why is Solana going up?
Solana’s rally is driven by technical breakout momentum, increasing volume, and strong ecosystem growth. Developer activity and on-chain use cases like DeFi and NFTs are attracting users and capital.
Can Solana reach $200 again in 2024?
Technically possible but Solana would need to break several resistance levels and sustain bullish market conditions to get back to $200. It all depends on the broader crypto market and network adoption.
What are the key resistance levels for Solana now?
Immediate resistance is at $154, and major resistance is at $158. A confirmed move above $158 could open the path to $165 and $180.
What if Solana goes below $145?
A drop below $145 could be a deeper correction and could push the price back to $140 which has been the recent support.
Glossary
Solana (SOL): A fast and low-fee blockchain used in DeFi and NFT applications.
Fibonacci Retracement: A technical analysis tool that shows potential support and resistance levels.
MACD (Moving Average Convergence Divergence): An indicator to identify changes in ‘trend, strength, momentum and duration.
RSI (Relative Strength Index): A momentum indicator to ‘measure speed and change of price movements, to identify overbought and oversold conditions.
Resistance/Support: Price levels where an asset tends to find selling (resistance) or buying (support) pressure.
Sources
Disclaimer: This article is for educational purposes only and not financial advice. Cryptocurrency trading carries risk. Always do your own research.


