Following the latest market signals, Ethereum appears to be in a correction phase after failing to break $5,000 in August 2025. Recent on-chain and futures data show a drop in Binance open interest, a metric that often precedes spot price corrections.
Along with falling exchange reserves and increasing institutional inflows, these signals suggest that the Ethereum local bottom may be near. What does this mean for price action, and is the market set for stability or further downside?
Binance Open Interest Dropped
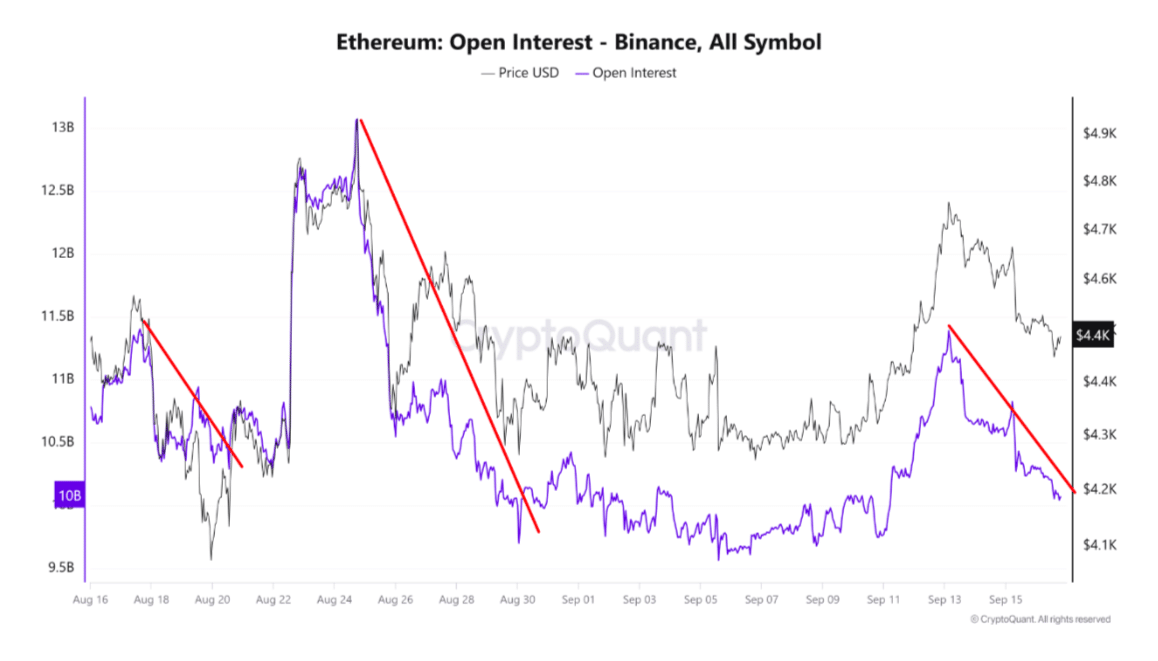
Binance ETH open interest (OI) has seen several big drops in the past few weeks. It fell from $11.4 billion to $10.2 billion on August 17, a 10.5% drop. A bigger 25% drop was seen on August 20 when OI went from $13 billion to $9.7 billion. Most recently, OI dropped 8.7% from $11.39 billion to $10.4 billion on September 13.
Withdrawals of leveraged positions often precede spot market corrections as traders reduce exposure in futures markets. According to CryptoQuant researcher Burak Kesmeci, Ethereum local bottoms in ETH spot price have formed after OI on Binance drops by around 14.9% on an hourly timeframe and spot price drops by 10.7%.
Also read: Ethereum Scarcity Ahead? Bitmine and Ether Machine Snap Up 2.4M ETH
Institutional Moves and Supply Trends Support the Zone
While derivatives data suggest a correction, fundamentals show strength. Ethereum staking deposits have reached an all-time high of 36.2 million ETH, and long-term holders are getting more confident. Exchange reserves are shrinking, and inflows into centralized exchanges have dropped significantly since mid-August.
US spot ETFs now hold 6.7 million ETH, almost double what they held in April 2025. Large addresses holding 10,000 to 100,000 ETH have added several million ETH to their holdings over this period. These supply constraints and accumulation trends may be putting a floor under ETH.
Price Action is Mixed Between Support and Resistance
$ETH is trading between strong support at $4,000 and resistance near recent highs at $4,900. Despite the correction, $ETH is above the September low of around $4,307. Breaking below $4,000 is a concern for many as that would open up more downside.
The resistance at $5,200 or $5,000 is the ceiling for now. Price action in this range is being watched for confirmation of a bottom.
What an Ethereum Local Bottom Would Mean
An Ethereum local bottom here would mean that leveraged positions have unwound and spot investors are comfortable accumulating or holding at these prices. It would mean reduced downside risk and Ethereum can resume its uptrend without extreme volatility.
A confirmed bottom would likely attract more institutional capital and less selling pressure if exchange reserves continue to decline. But until key support near $4,000 or slightly below is tested and holds, the bottom is speculative.

Key Indicators to Watch
Open interest on futures markets, especially Binance, is the leading signal. Further drops to around $9.69 billion could be the reset for OI that aligns with local bottoms. Spot price stability or bounce above $4,400 would confirm bottoming behavior.
Institutional demand via ETFs, staking inflows, and large wallet accumulation will be important to watch. Exchange balances if $ETH held on exchanges continue to decline, that means less immediate selling pressure. Macro factors like regulatory developments and market sentiment can’t be ignored.
Also read: Ethereum Investment Products See $912M Outflows as XRP and Solana Attract Inflows
Conclusion
Based on the latest research, Ethereum’s local bottom seems to be forming as current data suggest, supported by falling Binance open interest, shrinking exchange reserves, and growing institutional demand. Spot price is stuck between $4,000 support and $5,000 resistance with important levels in between.
If the metrics hold, OI drops to that estimated zone, strong accumulation by long-term holders, and price stability, then the risk of further downward move is reduced. Until then, some caution is warranted as $ETH tests critical support.
For in-depth analysis and the latest trends in the crypto space, our platform offers expert content regularly.
Summary
Ethereum has seen a decline in futures open interest, especially on Binance, which precedes spot drops. Institutional demand via ETFs and staking has grown, liquid supply on exchanges is shrinking. Price is range bound between $4,000 and $5,000. Local bottom may be forming if support holds and key indicators align.
Glossary
Open Interest: Total value of outstanding futures contracts that haven’t been settled.
Binance Open Interest: Open interest on Binance’s derivatives markets.
Staking Deposits: Amount of $ETH locked in staking by validators; more staking means less liquid supply.
Exchange Reserves: Amount of $ETH held on centralized exchanges; reductions mean less supply available for selling.
Fund Market Premium (FMP): Difference in price between futures contracts and spot market, reflects how much buyers are willing to pay for exposure via derivatives.
Frequently Asked Questions About Ethereum Local Bottom
What us a “local bottom” for Ethereum?
A local bottom is a price area where Ethereum has pulled back but where indicators suggest further decline is less likely. It doesn’t mean the absolute lowest possible price but a point from which recovery is possible.
Does falling open interest always mean price will fall?
Not always. Falling open interest can mean reduced leverage which sometimes precedes spot price corrections.
Can institutional demand override bearish futures signals?
If institutional accumulation, ETF inflows or stacking increase significantly, they can provide demand strong enough to counterbalance the negative pressure from derivatives or open interest decline.
What happens if $ETH breaks below $4,000?
A break below $4,000 would mean support is failing. That could mean more downside, possibly testing lower support zones, increased volatility and more cautious sentiment.


![Sun [New]](https://s2.coinmarketcap.com/static/img/coins/64x64/10529.png)
![BitTorrent [New]](https://s2.coinmarketcap.com/static/img/coins/64x64/16086.png)


