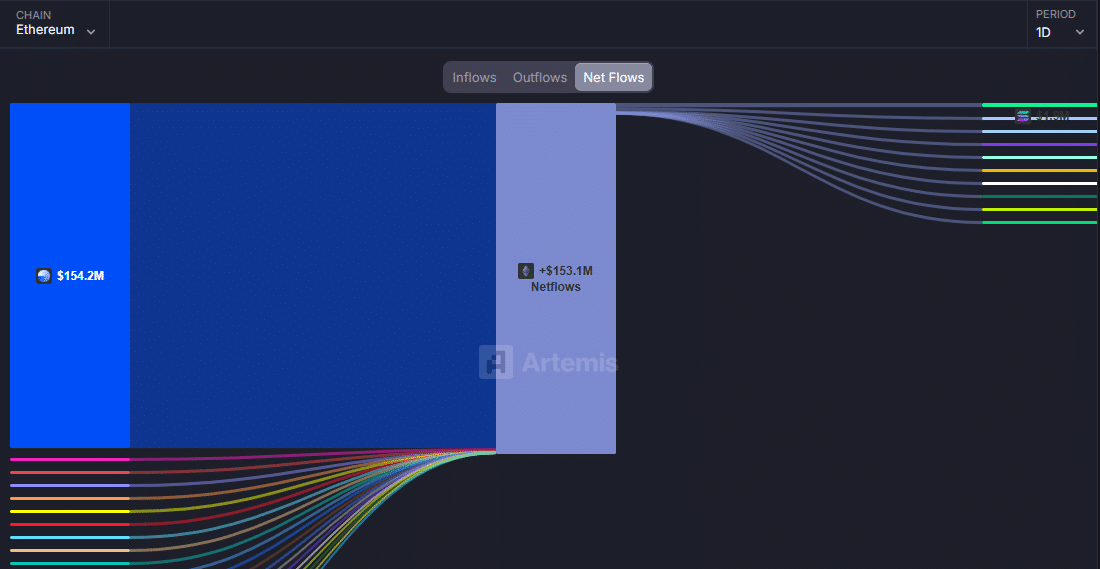
Ethereum recorded a massive $153 million in net inflows, yet the ETH price remained unmoved within a narrow trading range. There is a threat of further bearish sentiment being established concerning the following signals: technical and on-chain indicators send signals that market conditions should become more cautious. Despite strong capital movement, a mix of selling pressure and weakening market indicators kept the ETH price from rallying.
ETH Price Flat Despite Massive Inflows
Ethereum witnessed the highest Bridged Netflow in 24 hours, reflecting significant liquidity entering the ecosystem, especially from Base. Still, the ETH price traded flat, revealing a stark contrast between inflow volume and price movement. This imbalance highlights growing resistance from sellers and subdued demand at current levels.

This liquidity inflow should ideally trigger a price boost, but that hasn’t materialized in the short term. Market watchers attribute the price stagnation to persistent sell pressure that offsets bullish triggers. Furthermore, the token continues to consolidate tightly, struggling to escape a narrow channel since mid-May.
The support zone Ethereum hovers over has historically led to rebounds, yet the current setup signals a potential breakdown. Market sentiment is shifting rapidly, influenced by rising bearish positions and capital outflows. The ETH price now faces downward pressure, risking a possible breach of long-standing support.
DeFi TVL and Futures Data Reflect Rising Bearish Pressure
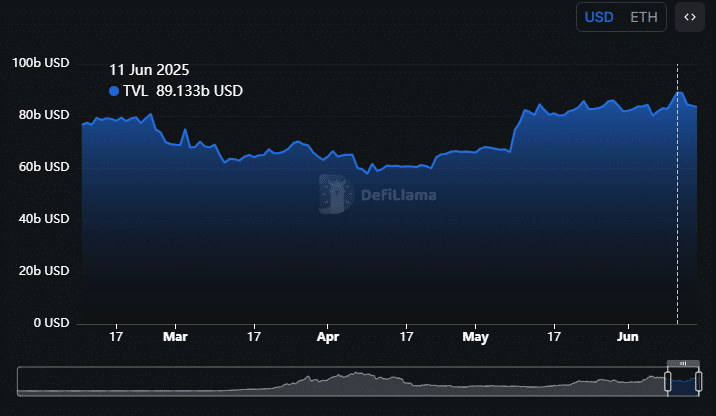
Ethereum’s Total Value Locked (TVL) dropped sharply by $4.6 billion in under two days, showing waning investor confidence. On June 11, the TVL stood at $89.13 billion but slid to $84.53 billion by press time. This sharp drop reflects ongoing capital flight from DeFi protocols built on Ethereum.

The futures market echoed the same sentiment as Open Interest fell from $41.43 billion to $34.66 billion. This $6.77 billion decline underscores reduced trader exposure and increased liquidations across major platforms. Market participants appear cautious, cutting risk as price momentum weakens.
Long liquidations outpaced shorts, accounting for $29.56 million, suggesting that many bullish traders were caught off guard. Total liquidations reached $13.30 million, indicating volatility even without large price swings. These signs point to a market under pressure, despite seemingly strong inflows and support levels.
Ethereum Recovery Stalls at $2,625 Mark
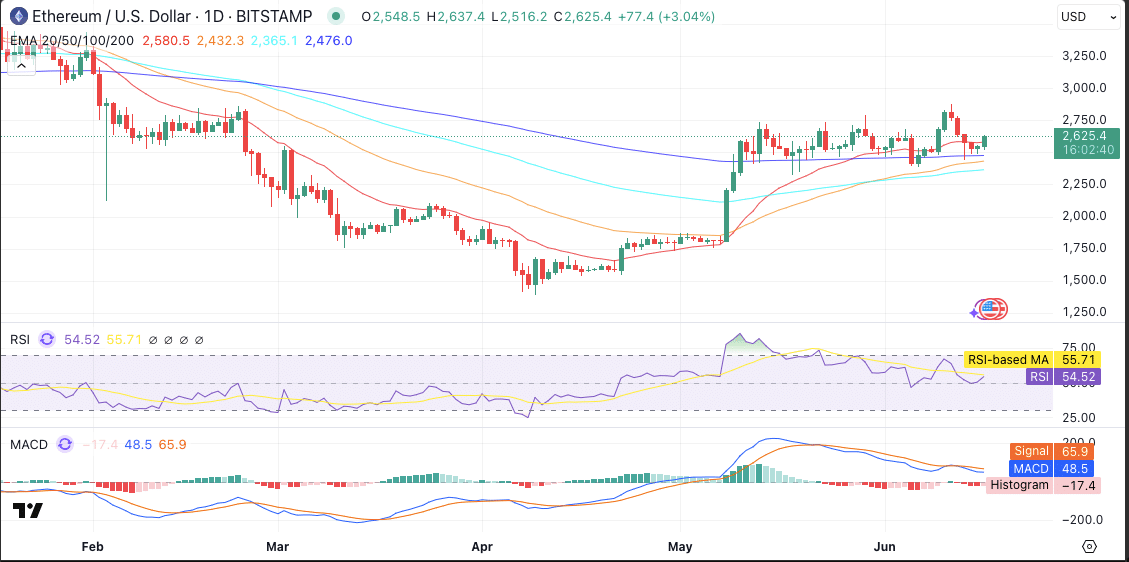
Ethereum experienced a temporary revival in recent times, surging to above the 2.6 thousand dollar mark and holding the 100-day exponential moving average during Monday trade. The ETH price pushed to $2,625, buoyed by mild optimism across crypto markets. Yet, there was no strength in the follow-up after the bounce.
The Relative Strength Index (RSI) is 54.52, which is a bit above the neutral point but not in the bullish range. Its average is trending upward; thus, it can gain with an increase in momentum. Nonetheless, MACD presents with bearish divergence, but the signal line starts to flatten out.

The price of Ethereum has maintained its mid-term bullish position, trading conspicuously above critical moving averages. Still, inability to remain above the 100-day EMA would open short-term risks on the downside.
ETH Price Table
| Date | Price | 24H Change | Volume |
| June 16 | $2,625 | 0.00% | $13.2 Billion |
| June 15 | $2,622 | +0.3% | $12.9 Billion |
| June 14 | $2,585 | -1.1% | $13.5 Billion |
| June 13 | $2,614 | +1.5% | $12.7 Billion |
FAQs
What is the current ETH price trend?
The ETH price remains in consolidation, hovering around $2,625 with no significant daily movement.
Why did ETH not rise despite strong inflows?
Strong sell pressure and liquidity outflows from DeFi protocols neutralized the positive impact of capital inflows.
What does the drop in Ethereum’s TVL suggest?
The TVL decline reflects reduced user confidence and shifting liquidity away from Ethereum-based DeFi.
Are traders reducing exposure to ETH?
Yes, futures Open Interest dropped by over $6 billion, signaling reduced participation or increased caution.
What key levels should ETH price hold to remain bullish?
ETH must stay above the 100-day EMA and hold the $2,500 support zone to prevent further downside.
Glossary of Key Terms
ETH Price – The current market value of one Ethereum token in USD.
Bridged Netflow – A metric tracking liquidity moving between chains and protocols involving Ethereum.
TVL (Total Value Locked) – The total USD value of all assets locked in DeFi protocols on the Ethereum network.
Open Interest – The total value of active futures contracts in the market.
Liquidation – Forced closure of a position when a trader cannot meet margin requirements.
EMA (Exponential Moving Average) – A weighted moving average used to identify trend direction.
MACD (Moving Average Convergence Divergence) – A momentum indicator showing trend direction and strength.
RSI (Relative Strength Index) – A measure of price momentum, typically used to detect overbought or oversold conditions.


